Blog
Notes on decisions, data and AI — from the work we do with companies every week.
5 Symptoms of a Broken Dashboard Culture
Organisations invest heavily in business intelligence tools, data infrastructure, and dashboard development. Yet many find that despite technically accurate data and visually polished charts, their dashboards go unused. The problem is rarely the data or the software. It is the culture and habits that have formed around reporting.
5 Signs You Need BI Outsourcing
Many companies invest in business intelligence tools and analytics talent, yet still struggle to get reliable, timely reporting. The signs of a struggling analytics function are often visible long before leadership admits there is a problem. Recognising these signs early can save significant time, money, and operational frustration.
NetSuite Customization vs Operational Layer: Which Option Is Faster and More Cost-Effective?
Companies that implement NetSuite often face a difficult choice. Business processes evolve, teams request changes, and the ERP system feels too rigid to keep up. The natural response is to request native customization from implementation partners. But when the quoted price reaches $100,000 and the delivery timeline stretches to six months, many leaders start looking for alternatives.
5 Signs You Need a Dashboard Redesign
Dashboards are designed to bring clarity, accelerate decisions, and build trust in data. However, many organisations invest significant resources in dashboard development only to find that their teams avoid using them or do not trust what they show.
Why Most Companies Fail at Scaling Analytics (And It’s Not Their Team’s Fault)
Many organisations struggle to scale their analytics function as they grow. Reporting becomes fragmented, dashboards lose credibility, and leadership teams find themselves making decisions based on intuition rather than data. The most common reaction is to blame internal resources or hire additional analysts. However, the root cause is almost never the people.
5 hard truths data therapy will tell you
Many companies invest significant resources in business intelligence tools, dashboard development, and data visualisation. Yet, despite having access to real-time metrics and beautifully designed reports, leadership teams still struggle to make confident, data-driven decisions.
ERP Data Source Audit: What to Check Before Building BI Dashboards
Investing in business intelligence dashboards is a logical step for any company that wants to make data-driven decisions. However, many organisations discover only after launch that their beautiful new dashboards do not reflect operational reality. Numbers do not match, statuses are inconsistent, and leadership still does not trust the reports.
5 questions every CEO should ask when data does not lead to clear decisions
Many companies have dashboards, BI tools, analytics reports, and performance metrics, but still struggle to make confident decisions. Leadership teams may review data every week, discuss KPIs, compare trends, and still leave meetings without a clear action plan.
Why small ERP changes can cost $100k and take six months
Many companies implement ERP systems such as NetSuite, SAP, Microsoft Dynamics, or Microsoft Business Central because they need structure, control, centralized data, and reliable business processes. These systems are powerful enterprise platforms that support finance, operations, procurement, inventory, project management, reporting, and many other critical functions.
How to reduce Excel dependency after NetSuite implementation
Many companies invest in NetSuite to centralize operations, improve reporting, automate workflows, and create a reliable source of truth for business data. In theory, after NetSuite implementation, teams should move away from disconnected spreadsheets and start managing core processes inside one structured ERP system.
Why project managers still use Excel after NetSuite implementation
Many companies implement NetSuite to centralize operations, improve project visibility, automate reporting, and create a reliable source of truth for business processes. In theory, after NetSuite implementation, project managers should be able to track project statuses, procurement, equipment, deadlines, installation stages, testing, responsibilities, and operational progress inside one structured ERP system.
When one project turns into 200 Excel files: how spreadsheet workarounds break ERP visibility
Many companies invest in ERP systems such as NetSuite, SAP, Microsoft Dynamics, or Business Central to centralize operations, improve reporting, and create a reliable source of truth for business processes. However, even after ERP implementation, teams often continue using Excel to manage daily work.
How to make NetSuite more usable without full customization
NetSuite is a powerful ERP system used by growing companies to manage finance, operations, projects, procurement, inventory, sales, reporting, and business processes in one centralized platform.
Perfect ERP software does not exist: why companies need customization, tuning, and flexible operational layers
Many companies invest in ERP systems such as NetSuite, SAP, Microsoft Dynamics, Microsoft Business Central, or other enterprise software platforms expecting that the system will solve operational complexity once implemented. The expectation is understandable.
Why expensive ERP software does not always solve business process problems
Many companies invest in powerful ERP systems such as NetSuite, SAP, Microsoft Dynamics, or Microsoft Business Central expecting that once the software is implemented, business processes will become structured, scalable, and easier to manage.
3 mistakes companies make when outsourcing a BI team: how to choose the right business intelligence partner
Outsourcing a BI team can be one of the fastest ways to improve analytics quality, reduce reporting complexity, and give leadership teams better visibility into business performance.
Data therapy for post-acquisition integration: how to align metrics, dashboards, and decision-making after a merger or acquisition
Post-acquisition integration is one of the most complex stages in business growth. On paper, the deal may look strategically sound: two companies combine resources, markets, products, customer bases, and operational capabilities. The acquisition thesis may be clear, the growth opportunity may be attractive, and the leadership team may have a strong plan.
5 signals a company needs data help: how to identify when business intelligence support is no longer optional
Many growing companies believe they need data help only when something is clearly broken. In reality, the need for business intelligence consulting, analytics strategy, KPI alignment, or dashboard optimization usually appears much earlier.
What happens when you choose the wrong BI partner: how to avoid costly mistakes in business intelligence projects
Choosing a business intelligence partner is not a small operational decision. For many companies, a BI partner influences how leadership teams see performance, interpret metrics, allocate budgets, and make strategic decisions.
Why clients come back: what strong client retention says about business intelligence quality
In business intelligence consulting, client retention is one of the strongest indicators of real service quality. A company may deliver a visually polished dashboard, complete a data warehouse implementation, or launch a reporting system on time, but the real test comes later: does the client return when a new analytics challenge appears?
How to understand that a company needs analytics (even if they don’t realize it): a practical guide to identifying data and BI gaps
Many companies operate with dashboards, reports, and analytics tools, yet still struggle with decision-making clarity. Leadership teams often feel that something is “off” — growth is inconsistent, performance is difficult to explain, and strategic decisions require more intuition than expected.
Standard dashboard vs decision-focused dashboard: how better BI design improves SaaS performance and simplifies decision-making
Many SaaS companies invest in dashboards and business intelligence tools expecting that better data visibility will automatically improve decision-making. Modern BI platforms such as Power BI, Tableau, Looker, and other analytics solutions provide access to detailed performance metrics across acquisition, activation, retention, revenue growth, and financial efficiency.
The strangest analytics request we received — and the real business problem behind it
In business intelligence consulting, client requests often sound very technical. Companies ask for dashboards, KPI reports, data warehouse implementation, or analytics strategy support. However, sometimes a request sounds unusual at first glance and reveals a deeper business challenge once analyzed carefully.
The most common analytics request from companies: what businesses actually want, expected timelines, and typical budgets for business intelligence projects
As organizations scale, their need for structured analytics, business intelligence, and data-driven decision-making becomes increasingly important. Companies across SaaS, e-commerce, fintech, and technology sectors invest in dashboards, reporting tools, and analytics teams to improve performance visibility and support strategic planning.
Where AI actually improves decision-making (and where it doesn’t): a practical guide to using AI in business intelligence
Artificial intelligence is rapidly becoming a central topic in business intelligence, analytics strategy, and digital transformation. Organizations across SaaS, e-commerce, fintech, and enterprise sectors are investing in AI-powered analytics tools to improve forecasting accuracy, identify risks earlier, and accelerate data-driven decision-making.
Why companies with more data often feel less confident: the hidden complexity problem in business intelligence
Over the past decade, companies have invested heavily in data infrastructure, analytics platforms, and business intelligence tools. Modern organizations now operate with advanced dashboards built in Power BI, Tableau, Looker, and other BI systems that provide access to large volumes of performance metrics across marketing, product, finance, and operations.
5 signs your analytics team is not delivering business value: how to identify hidden inefficiencies in business intelligence
Many companies invest in analytics teams, dashboards, and business intelligence tools expecting that access to data will automatically improve decision-making quality. Organizations implement Power BI, Tableau, Looker, and other analytics platforms to create visibility into performance metrics across marketing, sales, product, finance, and operations.
How much does bad analytics cost your business? Hidden financial losses caused by poor business intelligence
Many companies invest in dashboards, reporting tools, and analytics platforms expecting that access to data will automatically improve decision-making and business performance.
How to run a truly data-driven meeting (step-by-step): a practical framework for effective decision-making using business intelligence
Many organizations describe their leadership meetings as data-driven. Dashboards are presented, key performance indicators are reviewed, and performance metrics are discussed in detail. Business intelligence tools such as Power BI, Tableau, Looker, and other analytics platforms provide access to real-time insights across marketing, sales, finance, and operations.
When data looks too good to be true: how inconsistent metrics create hidden risks for growing companies
In modern organizations, dashboards and analytics platforms play a central role in decision-making. Companies rely on business intelligence tools such as Power BI, Tableau, Looker, and custom data platforms to monitor performance, evaluate growth, and guide strategic planning.
When should you actually use AI in analytics? A practical guide for companies implementing AI for decision-making
Artificial intelligence has become one of the most discussed topics in business intelligence, analytics strategy, and digital transformation. Companies across SaaS, e-commerce, fintech, and enterprise sectors are actively exploring AI-powered analytics tools, predictive models, and decision intelligence systems in an effort to improve performance and accelerate growth.
4 mistakes founders make when reading dashboards: how to interpret business intelligence metrics correctly
Modern companies rely heavily on dashboards, business intelligence tools, and analytics platforms to monitor performance and support decision-making. Solutions such as Power BI, Tableau, Looker, and other BI dashboards provide leadership teams with real-time visibility into key performance indicators, marketing results, financial metrics, and operational data.
3 ways to quickly find your real business bottleneck: a practical framework for data-driven decision-making
One of the most common challenges founders and executive teams face is identifying the real constraint that limits growth. Companies often assume they have a marketing problem, a sales problem, or a product problem, but deeper analysis frequently reveals a different reality.
The most common data mistakes founders make when building a company — and what they teach about business intelligence
Building a company is often described as a series of strategic decisions, hiring challenges, and execution risks. While this is true, one of the most underestimated sources of mistakes in growing businesses is how founders interpret data.
5 questions every CEO should ask before making a decision: a practical framework for data-driven decision-making
In modern organizations, decision-making happens under constant pressure. Leadership teams are expected to move fast, respond to changing market conditions, and scale operations efficiently. At the same time, companies have access to more data than ever before through dashboards, business intelligence tools, and analytics platforms.
Why companies struggle with growth in Q2: how to scale e-commerce and SaaS without amplifying hidden bottlenecks
The beginning of spring and the start of a new quarter often trigger a wave of growth initiatives across SaaS, tech, and e-commerce companies. Budgets are revisited, targets are increased, and leadership teams align around one priority: scaling faster.
Data therapy before fundraising: how founders can prepare their metrics and analytics for investor conversations
Raising capital is one of the most important milestones in the life of a startup or scaling company. Whether a founder is preparing for a Seed round, Series A, or later-stage investment, the conversation with investors inevitably turns to one central topic: data.
Why founders often misdiagnose their growth problems — and how structured data diagnostics reveal the real bottleneck
In conversations about business growth, founders often emphasize the uniqueness of their situation. Every company has a different market, product, pricing model, and competitive environment. At first glance, this assumption seems completely reasonable.
Why interpreting metrics matters more than tracking them: business intelligence insights for modern leaders
In today’s data-driven business environment, most companies do not suffer from a lack of metrics. They suffer from a lack of clarity.
Revenue is growing. So why does it feel wrong?
There is an old joke about someone proudly announcing that they have doubled their speed, only to realize they are running in the wrong direction. The improvement is measurable. The outcome is still disastrous.
How to diagnose hidden profitability decline in e-commerce
Revenue growth does not always equal business health.
BI fundamentals that remain the same across every industry
In conversations about business intelligence, companies often emphasize how unique their industry is. SaaS organizations focus on recurring revenue and churn analytics. E-commerce companies prioritize conversion rates and customer acquisition cost. Manufacturing firms analyze production efficiency and supply chain performance.
Why dashboards don’t work in meetings and how to fix it
Many companies invest in business intelligence tools, data dashboards, and analytics platforms, yet still struggle to make effective decisions during leadership meetings. The issue is rarely the absence of data visualization or reporting systems. The issue is misalignment between dashboards and decision-making processes.
The metrics pyramid every data-driven company needs
Many organizations invest in dashboards, business intelligence tools, and analytics platforms, yet still struggle to make confident decisions. The problem is rarely the absence of data. The problem is the absence of a structured KPI framework.
KPI clarity and executive coaching services
In many organizations, the problem is not a lack of dashboards, analytics tools, or data visualization platforms. The problem is the absence of KPI clarity.
Why companies don’t know what to track: KPI alignment in business intelligence
Many organizations invest heavily in business intelligence tools, data dashboards, and analytics software, yet still struggle to answer a simple question: Are we tracking the right metrics?
Why persistence drives early growth, but mindset defines long-term success
In business growth, the factors that determine success change much faster than most founders expect. What helps a company survive its early stage is often not what allows it to scale sustainably later. Understanding this shift is critical for leaders who want to build companies that grow beyond initial momentum and avoid stagnation once operational maturity is reached.
Why early-stage companies win with persistence, and mature ones win with resilience
I recently attended a girls’ school football championship in London, where my daughter was playing, and while watching teams that were still very early in their journey, I had a surprisingly clear business insight.
AI in Business Intelligence: From Signals to To-Dos
Artificial intelligence is rapidly transforming the field of business intelligence and data analytics, but most companies still experience AI as a tool for observation rather than decision-making. Today, AI in BI systems is primarily used to identify anomalies, trends, and performance changes across key metrics. In the near future, however, its role will evolve toward full decision support and automated operational guidance.
Data Erosion: Why Your Dashboards Stop Working Even When the Data Is Correct
In modern Business Intelligence and data analytics environments, companies invest significant resources into building accurate dashboards, reliable data pipelines, and well-structured reporting systems. However, there is a subtle but highly destructive problem that many organizations overlook: even perfectly accurate dashboards can gradually lose their effectiveness over time. This phenomenon can be described as data erosion.
Outsourced BI vs In-House Business Intelligence Team
As companies become more data-driven, one strategic question appears sooner or later: should Business Intelligence be built internally or outsourced to a specialized provider? The choice between an in-house BI team and outsourced Business Intelligence services affects not only costs, but also speed of execution, data quality, and long-term scalability.
Best Practices in Business Intelligence for SaaS Companies
Business Intelligence for SaaS companies is often perceived as something highly specific and dependent on product, market, and growth stage. While context certainly matters, there are well-established best practices in BI for SaaS that remain valid across different business models, pricing strategies, and technical stacks. The most successful SaaS analytics systems are not built around tools alone, but around consistent principles that allow teams to trust their data and use it for operational and strategic decision-making.
Data Visualization for Pitch Decks and Investor Presentations
In modern fundraising and investor relations, data visualization plays a critical role in how companies communicate their business performance, growth potential, and strategic vision. Investors do not evaluate startups and scale-ups based on raw numbers alone. They evaluate how clearly those numbers explain the story of the business. This is why data visualization for pitch decks and investor decks has become a core element of successful fundraising strategies.
Data Reflection and Data Therapy: Why Psychology Matters in Business Analytics
In most organizations today, the problem is no longer the absence of data. Companies invest heavily in business intelligence systems, data warehouses, dashboards, and reporting tools. Marketing teams track conversion rates, finance teams monitor margins, and product teams follow retention and engagement metrics. From a technical perspective, the data infrastructure often works reasonably well.
Is AI Shrinking the Data Analytics Market — or Expanding It?
Alongside concerns about job displacement, many executives and founders are asking a broader strategic question: Is artificial intelligence reducing the overall demand for data analytics services, or is it expanding the market?
Business intelligence best bractices across industries: what Is universal and what depends on context
One of the most common questions companies ask when building or scaling their Business Intelligence function is whether there are universal best practices, or whether everything depends entirely on the industry, geography, and business model. The short answer is that both are true, but at different architectural and strategic levels.
Will AI Take Analysts’ Jobs? A Realistic Look at the Future of Data Analytics
Over the past few years, the question “Will AI replace data analysts?” has moved from speculative discussions to boardrooms, hiring plans, and career decisions. With the rapid development of large language models, automated analytics platforms, and AI-powered business intelligence tools, many companies are trying to understand whether human analysts will remain a core part of data-driven organizations or gradually become obsolete.
Dashboard design for startups: how to build analytics that actually support growth
For many startups, dashboard design is one of the first serious steps toward becoming a data-driven business. Founders quickly realize that intuition alone is not enough, yet dashboards often become overloaded, confusing, or disconnected from real decisions. The result is familiar: dashboards exist, but they are rarely trusted or actively used.
Data analytics and visualization services pricing: what companies actually pay for
When companies start evaluating data analytics and visualization services pricing, they often expect a simple price list: dashboards cost X, reports cost Y, and advanced analytics costs Z. In reality, pricing in data analytics rarely works that way, because what businesses are actually paying for is not charts or tools, but decision-making capability, reliability, and speed of execution.
How the Data Market Is Really Changing: What Did Not Happen — and What Comes Next
Over the past few years, the data and business intelligence market has been surrounded by bold predictions. Artificial intelligence was expected to replace junior data analysts, business intelligence tools were supposed to become fully no-code, and decision-making was promised to become almost automatic.
Visual Analytics for Marketing Teams: Turning Data Into Decisions, Not Just Dashboards
In modern marketing environments, teams operate in a landscape where advertising platforms generate millions of impressions, customer journeys span across multiple channels, and budgets need to demonstrate measurable ROI faster than ever. Under these conditions, visual analytics for marketing teams has shifted from a helpful addition to an operational necessity, because it enables companies to transform scattered marketing data into clear insights and confident decisions.
Why Data Therapy Is the Right Framework for Modern Business Analytics
In recent years, many companies have invested heavily in business intelligence tools, analytics platforms, and data dashboards, yet a surprisingly large number of them still struggle to make confident, timely decisions based on their data. This paradox is exactly why the concept of Data Therapy resonates so strongly and why it has become a useful framework for understanding how analytics should actually support business growth.
Data Dashboards for eCommerce Performance Tracking: Turning Metrics into Profitable Decisions
In eCommerce, growth rarely fails because of a lack of data. It fails because data is fragmented, delayed, or disconnected from decision-making. Orders are growing, traffic looks healthy, marketing spend keeps increasing — yet profitability remains unclear, and teams argue over numbers instead of acting on them. This is precisely where data dashboards for eCommerce performance tracking become a strategic necessity rather than a reporting convenience.
Why businesses wait too long to fix reporting problems — and what it really costs
Many companies live with small but persistent inefficiencies in their reporting and analytics systems for far longer than they should. The data is available, reports exist, and decisions are being made, yet something always feels harder than necessary. Numbers need to be manually checked, sources reconciled, and metrics verified before anyone can confidently act.
Green Flags to Look for in Data Analysts
Hiring data analysts has become significantly more complex over the past few years, not because there are fewer candidates, but because there are more of them, and many look similar on paper. Almost everyone lists SQL, dashboards, Python, cloud platforms, and “business insights” on their CV. The real challenge for companies today is understanding how to distinguish a strong data analyst from someone who merely checks the technical boxes.
BI Dashboards for SaaS Metrics: LTV, Churn, CAC and Sustainable Growth
For Software as a Service (SaaS) companies, data is not a supporting function — it is the operating system of the business. Pricing decisions, growth strategy, hiring plans, and even product roadmaps are shaped by a small set of core metrics that describe how customers are acquired, monetised, and retained. Business Intelligence (BI) dashboards for SaaS metrics exist precisely to make these signals visible, comparable, and actionable on a daily basis.
Data therapy: unlocking business growth with actionable insights
In today’s fast-paced business world, data is the key to growth. However, businesses often get stuck not because of a lack of data, but because they fail to fully understand or leverage it. Just like personal therapy helps individuals unlock their emotions and improve their mental health, Data Therapy helps businesses unlock the full potential of their data to identify and solve problems, improve performance, and drive growth.
Why the Most Dangerous Thing for Your Business is Not Making Decisions
After working with data and business owners for over 10 years, one thing has become crystal clear to me:
An Insight of This Year That Became an Eye-Opener: Why Speed Matters More Than Perfect Dashboards
Over the years, we’ve been focused on creating polished, visually appealing, and highly functional dashboards for our clients. For a long time, I thought that was the primary value we were providing. After all, dashboards are at the heart of business intelligence. They present data in a way that’s easy to understand, make decisions faster, and provide actionable insights. But this year, I realized something much more important about what our clients truly need: it’s speed, not just great dashboards.
What Makes Scaling a Business Intelligence Company Truly Difficult — and Why It Matters for Clients
Growing a company in the fields of business intelligence (BI), data analytics, and decision-support systems is often perceived as a purely technical challenge. Many assume the complexity lies in hiring data engineers, building ETL pipelines, designing Power BI dashboards, or maintaining a reliable analytics infrastructure.
How we broke our own rule in 2025 and what we’ll do about it
We have two slogans at Data Never Lies.
KPI Dashboards for Real Estate & Property Management:
In most real estate and property-management companies, operational conversations still revolve around physical assets — the square meters leased, the facilities maintained, the tenants onboarded — while the digital “assets” of the business, namely data, remain scattered across spreadsheets, emails, accounting tools, and property-management platforms. Yet as the industry becomes increasingly complex, with rising maintenance costs, shifting rental demand, and higher expectations for reporting transparency, the companies that stand out are the ones that treat data as carefully as they treat their buildings.
When We Decline BI Projects — and Why It Can Be the Best Decision for the Client
Companies usually approach us when they need help with business intelligence, data analytics, dashboard development, or reporting automation. Most of the time, we can help immediately, but there are situations where starting a full BI project is not the right move yet.
Marketing ROI Dashboards for Agencies: How to Build Reliable, Actionable Reporting That Clients Trust
For modern marketing agencies, the ability to clearly demonstrate Return on Investment (ROI) has become one of the most critical factors that determine whether clients continue long-term cooperation, scale budgets, or reconsider their strategic direction. As marketing channels multiply, customer journeys become more fragmented, and data sources grow increasingly complex, agencies need reporting systems that not only visualise results but also help both sides — agency and client — make confident, data-driven decisions. This is exactly where Marketing ROI dashboards become indispensable.
What Companies Most Often Request from DNL and How We Built a Process to Deliver Business Intelligence Fast
Across hundreds of conversations with potential clients, one request appears more frequently than any other: an urgent need to develop or redesign business intelligence dashboards, improve reporting quality, or stabilise existing analytics processes. Although companies often describe the problem as “we need a dashboard,” the true challenge is almost always deeper.
How modern analytics transforms hotel performance, operations, and guest experience
The hospitality industry operates in a fast-moving, high-pressure environment where margins are sensitive, demand changes daily, and operational efficiency directly impacts guest satisfaction. In this context, Power BI has become one of the most effective tools for building a unified operational view across properties, teams, and data sources, allowing hotels, resorts, and hospitality groups to make decisions based on real-time insights rather than intuition.
When Data Stops Helping: Understanding and Overcoming Data Paralysis in Business Intelligence
Modern companies are generating more data than ever before. Every department — from marketing to finance — now relies on business intelligence systems to monitor performance, track metrics, and guide decisions.
When Data Meets Imagination: Predictive Analytics for a Virtual Modelling Agency
At Data Never Lies, we work with clients from very different industries — from finance and healthcare to e-commerce and creative technologies.
Government Intelligence: what if countries made decisions like companies do
Working with companies of all sizes, I often catch myself thinking about how business intelligence — dashboards, analytics, modeling, and data-driven decision-making — could change not just organisations, but governments.
Connect GA4 and HubSpot to Power BI / Looker Studio: A Practical Guide
In today’s analytics-driven world, bringing together data from your website and your customer-relationship management (CRM) system is more than a nice-to-have. It is essential. Integrating Google Analytics 4 and HubSpot into your business-intelligence stack unlocks unified insights, enables smarter dashboards, and ensures decision-makers see the full story. This article explains how to connect GA4 and HubSpot to Power BI and Looker Studio, what you must watch out for, and how to build the right pipeline for lasting value.
What really matters when growing from $1M to $10M
This year, our company crossed an important threshold — we moved into the “one to ten million” revenue cohort. It still feels a little unreal when I say it out loud. Two and a half years of experiments, mistakes, and bold steps later, we are finally here. And looking ahead, in the next 3-4 years, we’re planning to hit $10M in revenue.
Building a data culture: how to make business intelligence part of daily work
Every company talks about being data-driven. Few actually are.
Better a fast wrong decision than a slow one
We’ve been thinking a lot about how companies make decisions, especially after almost ten years of working with data and business intelligence.
How machine learning helps detect anomalies and early warning signals in business intelligence systems
Most companies today rely on business intelligence systems to track performance and guide decision-making. But as data grows, so does the noise. Somewhere inside that ocean of metrics, tiny shifts—early signs of risk or opportunity—can go unnoticed.
Reducing churn before it happens: how early signals help retain customers
In today’s subscription-driven economy, retention matters as much as acquisition. For companies operating under the Software as a Service (SaaS) model — that is, businesses providing online software by subscription — reducing churn before it happens is a strategic imperative, not a nice-to-have. When you monitor the right early warning signs of churn, you give your business a real chance to intervene, keep customers engaged, and protect your recurring revenue stream.
When to outsource business intelligence and when to build it inside
There are two types of functions in any company. The first group consists of those that you understand deeply — for us, that includes business analytics, project delivery, and partly sales. The second group covers everything where your expertise is limited or missing entirely.
The most beautiful dashboard I’ve ever seen wasn’t ours
The best SaaS analytics dashboard I’ve ever seen wasn’t built by my team. It was built by our client — a global company with thousands of employees.
Why AI for Business Intelligence Still Doesn’t Work (Yet)
Artificial intelligence promises a future where dashboards explain what went wrong, why it happened, and what to do next. One day, that vision will become reality. For now, the gap between expectations and results remains wide.
The one honest metric in SaaS: why logo retention beats MRR and CAC
Most SaaS founders misunderstand the main point of their business, especially early on. I see it every day. We’ve spent the past three years analyzing data and building BI systems for over a hundred SaaS companies, from $1M ARR to $30M ARR. The same pattern keeps repeating itself: everyone is looking in the wrong direction. Founders obsess over MRR, ARR, and CAC; they chase growth. But almost no one looks at Logo Retention – the simplest, most brutal metric in SaaS.
UX/UI Dashboard Audit: Turn “nice charts” into decisions
If your company already has dashboards and the data is correct, yet decisions still stall, you don’t have a data problem—you have a dashboards audit problem. A focused UX/UI dashboards and reports audit makes visualizations actionable: it removes noise, clarifies “good/bad” at a glance, and shows the next step for each role.
2035: The Future of Business Intelligence in Food Manufacturing
From Plant to Shelf—How Food Producers (Finally) Stopped Guessing
2035: The Future of Business Intelligence in B2B Sales
How Modern BI Will Save You from Pipeline Anxiety (and Bad Deals)
B2B Sales Dashboards: From Pretty Charts to Decisions That Pay
If your B2B Sales Dashboards are multiplying while revenue is not, welcome to the most common paradox in sales analytics: dashboards grow like weeds, while pipeline velocity does not. The result? Managers spend Mondays staring at charts and Fridays still guessing why revenue missed.
2035: The Future of Business Intelligence in SaaS
From Spreadsheets to AI Product Managers—How SaaS Decision-Making Will Actually Work
2035: AI Future of Business Intelligence for Airlines
If you’re running an airline in 2035, you’re not just moving metal from point A to point B. You’re piloting a digital intelligence ecosystem that—let’s be honest—probably knows more about your network profitability than half your management team.

2035: The Future of Business Intelligence in E-commerce
From Manual Exports to AI Commerce Strategists—How Decisions Will Actually Happen

2035: The Future of Business Intelligence in Manufacturing
From Spreadsheets to AI Shopfloor Supervisors—How Manufacturing Decisions Will Actually Get Made

Why Your Charts Still Don’t Tell the Story: Audit Reports and Dashboards
When Reports and Dashboards Start to Annoy

How TOP Airlines Are Building the Future of Business Intelligence
In the highly complex world of aviation, speed of decision-making is everything. Delays, cost overruns, operational inefficiencies, or missed opportunities — all trace back to how fast and accurately an airline can respond to emerging signals. That’s why the world’s leading carriers are quietly undergoing a revolution in Business Intelligence (BI). This article explores the three key initiatives shaping the next-generation Decision Intelligence stack in aviation: centralized data catalogs, data storytelling, and signal-to-action systems.

Why Most Airline Dashboards Are Terrible
And what it’s quietly costing you in delays, fatigue, and wasted man-hours

2035: When Business Intelligence Gets Its Pilot License
If you’re running an airline in 2035, you’re not just moving metal from point A to point B. You’re piloting a digital intelligence ecosystem that—let’s be honest—probably knows more about your network profitability than half your management team.

How to Make Your Data Team 10x More Effective
There’s a dirty secret behind most business intelligence teams: the majority of their time is spent not on insights, but on confusion.

Why US Companies Are Outsourcing Business Intelligence More Than Ever
What’s really driving the new wave of BI outsourcing — and how internal teams are learning to thrive alongside it.

The Top 7 Dashboard Mistakes of 2025 (and How to Fix Them)
Ah, dashboards. The modern executive’s window into their company’s soul. Or at least, it should be. But after reviewing hundreds of dashboards from clients in SaaS, e-commerce, retail, and manufacturing in the first half of 2025 alone, we’ve realized something uncomfortable: most dashboards are… broken.

The Future of Decision-Making: You Won’t Be Making Decisions Anymore
By 2035, managers likely won’t be making decisions at all.

Business Intelligence Is an IKEA Sofa: A Survival Manual for Decision Chaos
If every meeting turns into a presentation battle, each department has its own version of the truth, and your managers look like they’ve just survived Burning Man (without the fun) — congratulations. You’re ready. Not spiritually, but for the BI Maturity Framework.

Enterprise-Grade BI Is No Longer Just for the Big Guys — Here’s How Mid-Sized Firms Are Catching Up
Once reserved for Fortune 500 giants with million-dollar data teams, enterprise-level Business Intelligence is now quietly transforming mid-sized companies. What changed? Not the technology — but the playbook.

The Best Dashboard Practice Framework: From Data Clutter to Decisive Action
Every company wants data clarity. Few achieve it. The reason? They mistake dashboard creation for dashboard thinking. A dashboard isn’t a place to display data. It’s a place to detect signals and make decisions. This is a framework for how to build a dashboard system that does exactly that.
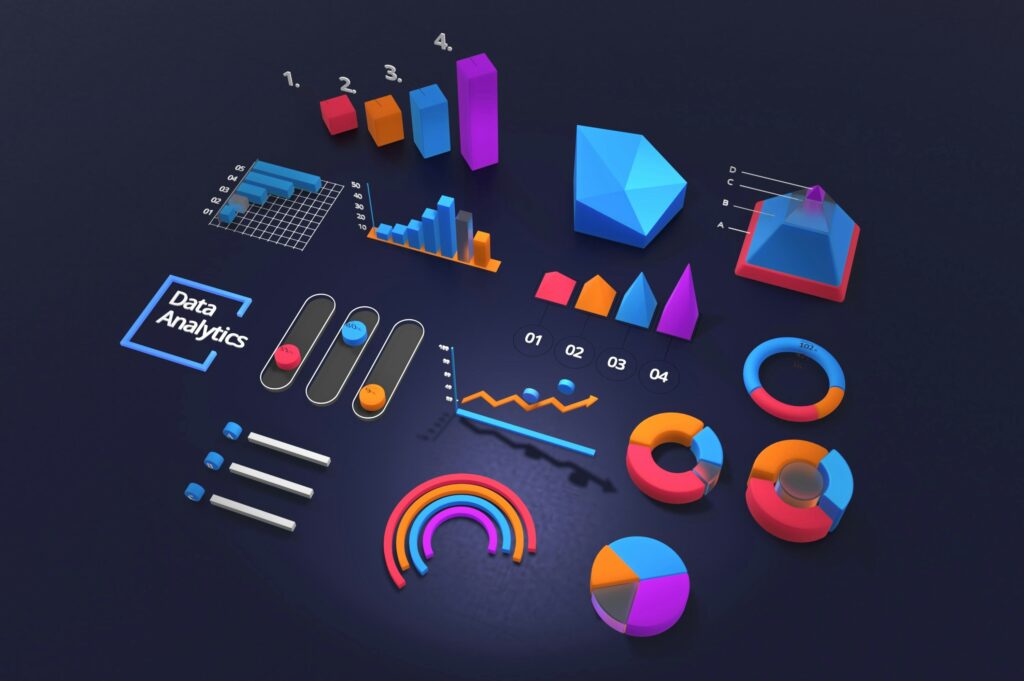
Why Most Dashboards Are Terrible
And what it’s quietly costing your business every single day

C-Level Guide: How to build a Decision Engine that can’t be stopped
Indecision is quiet but costly. It drains momentum, blurs accountability, and leaves teams stuck in endless recurring meetings. Still, in many companies, slow decision-making is business as usual.