Launch Best-in-Class Construction Business Intelligence in Just 48 Hours
45
Data Sources
123
Metrics / KPIs
136
Charts
5
AI decision making assistants
Launch Best-in-Class Construction Business Intelligence in Just 48 Hours
45
Data Sources
123
Metrics / KPIs
136
Charts
5
AI decision making assistants
Are our projects finishing on schedule?
How are actual costs comparing to budgeted costs?
What percentage of our bids are being accepted?
Are we maximizing the use of our equipment assets?


Virtual Show Room
If you want to see how top consulting firms use data to deliver value and scale client impact, join our showroom session. We’ll walk you through the platforms they rely on — such as Salesforce, Power BI, HubSpot, and Asana — and show how they integrate data across client engagements, internal operations, and marketing efforts. Together, we’ll explore key metrics like billable utilization, project margins, client acquisition cost, and proposal win rates, and review dashboards used for performance tracking, forecasting, and client reporting. By the end of the session, we’ll outline a tailored decision-making system built around your firm’s workflows and strategic goals.
Best Practice Data Stack
At Data Never Lies, we understand that consulting firms rely on data to drive client outcomes, manage resources, and scale operations. That’s why we build tailored analytics systems using tools like Power BI, Salesforce, Tableau, and Monday.com — designed to unify data across project delivery, sales pipelines, and team performance. From tracking billable utilization and client ROI to analyzing project timelines, win rates, and revenue per consultant, we create scalable data stacks that support both strategic decision-making and day-to-day visibility. With our expertise, your data becomes more than organized — it becomes a clear, compelling story that drives measurable impact for your clients and your firm.
42 Data Sources
Launch Best-in-Class Consulting Company Business Intelligence in Just 48 Hours

Sage 300 Construction
An accounting and project management solution designed for large-scale construction firms to manage finances, jobs, and operations.

Buildertrend
A construction management software for homebuilders and remodelers, providing tools for scheduling, budgeting, communication, and client management.

PlanGrid
A mobile-first software for construction document management, allowing teams to access plans, markups, and project updates in real time.

Autodesk Construction Cloud
A unified platform offering tools for design, planning, construction, and operations to improve workflows and collaboration.

Procore
A cloud-based construction management platform for project planning, collaboration, budgeting, and document management across teams.

CoConstruct
A project management tool for custom homebuilders and remodelers, enabling budgeting, scheduling, and client communication.

Viewpoint
A construction software suite for project management, financials, and field operations, tailored to streamline construction workflows.

Bluebeam Revu
A PDF-based construction software for markup, collaboration, and document management, improving project accuracy and communication.

Trimble
Provides advanced construction solutions for site positioning, 3D modeling, and project management using data-driven workflows.

eSUB
A project management software tailored for subcontractors, helping manage documents, RFIs, and field communications.

Oracle Primavera
A project scheduling and portfolio management software for planning, managing, and optimizing large-scale construction projects.

Fieldwire
A field management app for jobsite coordination, task tracking, and real-time plan access to enhance productivity.

RedTeam
A construction project management platform offering tools for estimating, scheduling, budgeting, and team collaboration.

Jonas Construction Software
An integrated solution for accounting, project management, and service management, tailored for construction businesses.

Autodesk BIM 360
Autodesk BIM 360: A cloud-based platform for Building Information Modeling (BIM) that connects project data, teams, and workflows.
123 Metrics
Launch Best-in-Class Consulting Company Business Intelligence in Just 48 Hours
AFR
Accident Frequency Rate: Tracks the number of workplace incidents per hours worked, providing insights into project safety performance.
EUR
Equipment Utilization Rate: Measures actual equipment usage time versus total available time to identify efficiency, downtime, or underutilization.
BSR
Bid Success Rate: Evaluates the percentage of submitted bids awarded to the company, indicating competitiveness and proposal effectiveness.
CV
Cost Variance: Calculates the difference between estimated budget and actual spending, highlighting cost overruns or savings during project execution.
PCR
Project Completion Rate: Measures the percentage of projects finished on schedule and within scope compared to total initiated projects.
COF
Change Order Frequency: Monitors the number of changes requested after project initiation, indicating planning issues or evolving project needs.
PP
Project Profitability: Compares total project revenue to costs incurred, assessing financial success and overall profit margins.
SV
Schedule Variance: Quantifies delays or advancements by comparing actual progress against planned timelines to ensure timely project delivery.
SP
Subcontractor Performance: Evaluates subcontractors based on quality, adherence to schedules, cost efficiency, and contract compliance.
CFF
Cash Flow Forecast: Predicts future project expenses and income, ensuring funds are available to sustain operations and meet financial goals.
RH
Rework Hours: Monitors the total time spent correcting mistakes, identifying inefficiencies in processes and quality control measures.
CSS
Client Satisfaction Score: Measures client happiness through ratings, surveys, or reviews to gauge project success and service quality.
RFI
Request for Information (RFI) Response Time: Measures the average time taken to respond to RFIs, preventing delays and improving project clarity.
BOW
Backlog of Work: Represents incomplete tasks or projects awaiting resources, highlighting workload management and potential scheduling bottlenecks.
DR
Defect Rate: Tracks the percentage of deliverables requiring rework or corrections, reflecting quality assurance and production standards.
136 Charts
Launch Best-in-Class Consulting Company Business Intelligence in Just 48 Hours
Accident Rate Over Time
Accident Rate Over Time (Line Chart): Tracks safety incident rates across time, revealing trends and improvements in workplace safety.
Utilization Over Time
Utilization Over Time (Line Chart): Measures equipment or resource usage trends over time to identify inefficiencies or improvements in operational capacity.
Bid Success Percentage
Bid Success Percentage (Bar Chart): Visualizes the percentage of successful bids relative to total bids, comparing performance across periods or teams.
Cost Variance Over Time
Cost Variance Over Time (Line Chart): Displays budget deviations across periods, highlighting cost overruns or savings throughout project phases.
Completion Rate Over Time
Completion Rate Over Time (Line Chart): Tracks project completion percentages over time, showing trends in timely delivery performance.
Change Orders Over Time
Change Orders Over Time (Bar Chart): Shows the frequency of project changes requested over time, identifying patterns in scope adjustments.
Profitability Over Time
Profitability Over Time (Line Chart): Displays profit trends over time by comparing revenue and costs across project periods.
Schedule Variance Over Time
Schedule Variance Over Time (Line Chart): Measures deviations from planned schedules over time, highlighting delays or ahead-of-schedule progress.
Performance Rating
Performance Rating (Bar Chart by Subcontractor): Compares subcontractor performance ratings based on metrics like quality, timeliness, and compliance.
Cash Flow Over Time
Cash Flow Over Time (Area Chart): Visualizes inflows and outflows of cash, identifying trends in financial health and liquidity.
Average RFI Response Time
Average RFI Response Time (Line Chart): Tracks average time to respond to RFIs over time, improving project communication efficiency.
Backlog Over Time
Backlog Over Time (Area Chart): Displays pending work trends, revealing workload management and resource allocation issues over time.
Defects Over Time
Defects Over Time (Line Chart): Tracks the number of defects reported over time, reflecting quality control improvements or issues.
Client Satisfaction Over Time
Client Satisfaction Over Time (Line Chart): Shows client satisfaction trends based on feedback or surveys over project phases.
Rework Hours Over Time
Rework Hours Over Time (Line Chart): Tracks hours spent on rework over time, identifying quality issues or process inefficiencies.
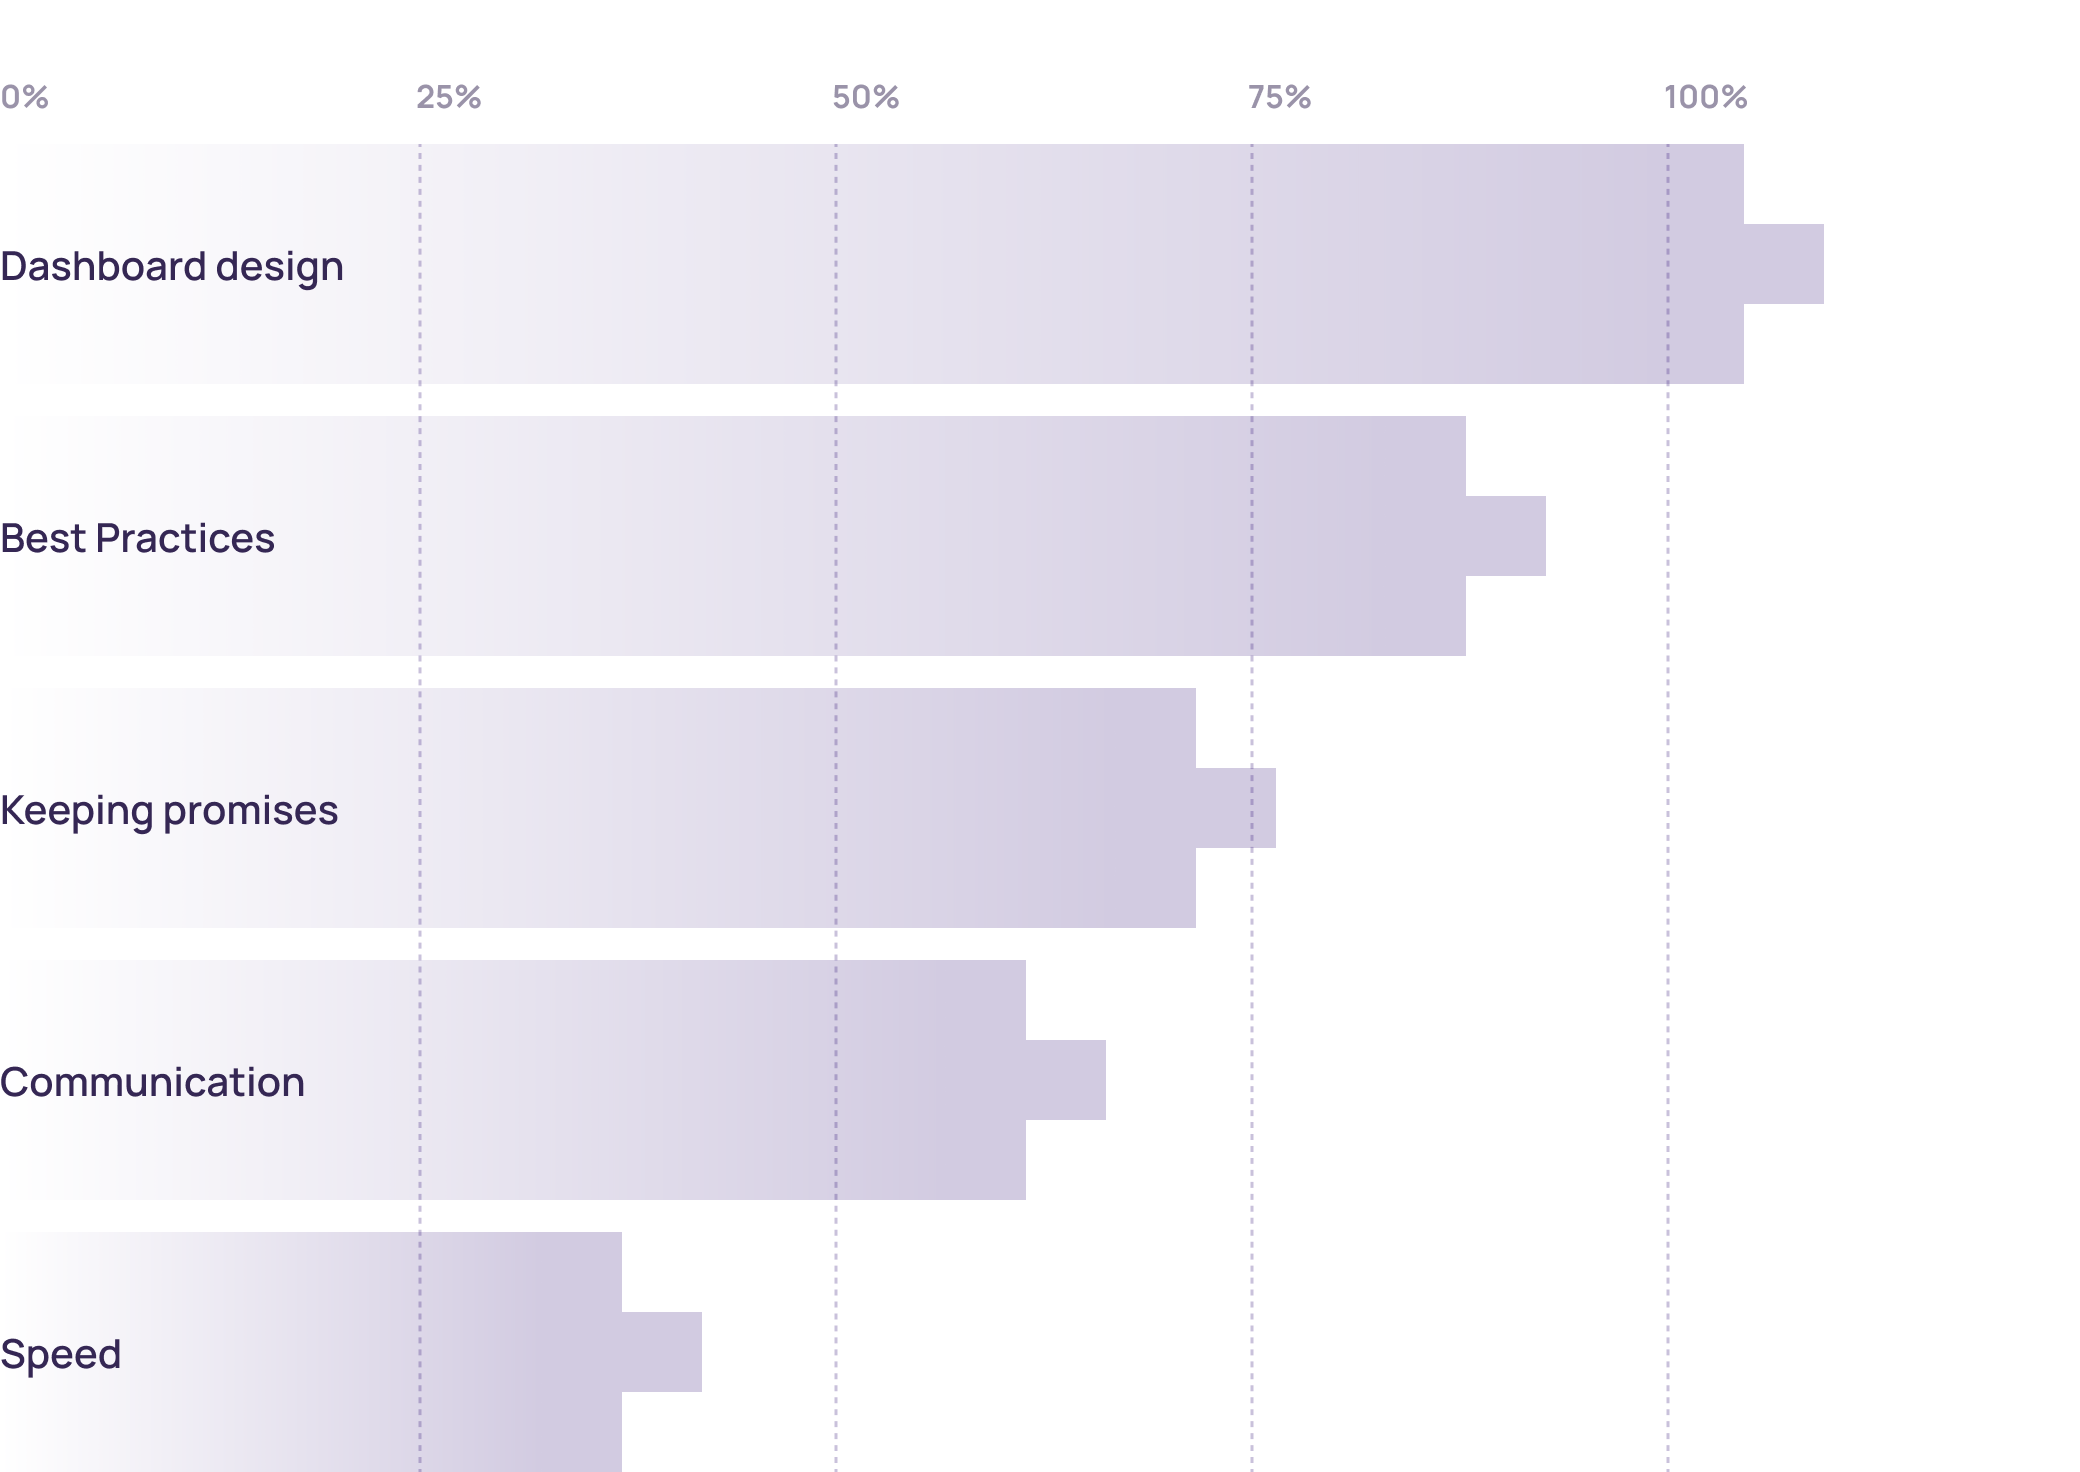
Why customers love us (>100 reviews)
We’ve identified the top five reasons why our clients choose to work with us and continue partnering with us for years.