Launch Best-in-Class Traditional Schools Business Intelligence in Just 48 Hours
41
Data Sources
55
Metrics / KPIs
81
Charts
2
AI decision making assistants
Launch Best-in-Class Traditional Schools Business Intelligence in Just 48 Hours
41
Data Sources
55
Metrics / KPIs
81
Charts
2
AI decision making assistants
Are we experiencing a rise or fall in customer attrition?
What is the projected revenue from a customer?
Which acquisition channels are the most cost-efficient?


Virtual Show Room
If you want to see how leading traditional schools use data to enhance academic performance, resource planning, and student support, join our showroom session. We’ll walk you through the systems they rely on — such as PowerSchool, Blackbaud, Skyward, and Power BI — and show how they integrate data from attendance, grades, behavior, staffing, and extracurricular programs. Together, we’ll explore key metrics like student achievement, teacher-to-student ratio, attendance trends, graduation rates, and resource allocation efficiency, and review dashboards used for academic planning and school leadership decisions. By the end of the session, we’ll outline a prototype decision-making system tailored to your school’s specific needs and goals.
Best Practice Data Stack
At Data Never Lies, we understand that traditional schools rely on clear, accurate data to support student achievement, allocate resources, and improve outcomes. That’s why we build scalable data systems using platforms like PowerSchool, Skyward, Blackbaud, and Power BI — tailored to unify student records, academic performance, attendance, staffing, and budgeting. From tracking metrics like GPA trends, attendance rates, teacher-to-student ratios, and standardized test scores to creating dashboards for principals and district leaders, we help schools turn data into decisions. With our expertise, your data isn’t just managed — it becomes a powerful story that drives academic success and operational excellence.
41 Data Sources
Launch Best-in-Class Traditional Schools Company Business Intelligence in Just 48 Hours

PowerSchool
A student information system (SIS) managing enrollment, grades, attendance, and communication for K-12 schools.

Infinite Campus
comprehensive SIS offering student records, scheduling, attendance, and communication tools for schools and districts.

Skyward
An SIS providing student data management, grading, and financial tracking for K-12 schools and districts.

Blackbaud
A cloud-based education management system for private schools, handling admissions, fundraising, and student data.

Alma
A modern SIS that streamlines student records, grading, and school administration for educators.

RenWeb
A cloud-based SIS (now FACTS SIS) providing attendance, grading, and communication tools for private schoolsю

FACTS SIS
A school management system handling tuition, enrollment, attendance, and academic records for private and faith-based schools.

SchoolAdmin
An enrollment and admissions management system designed to streamline application processing and tuition payments.

SchoolMint
A cloud-based enrollment and school choice platform simplifying application management for K-12 schools.

ClassDojo
A classroom communication app that connects teachers, students, and parents through messaging, progress tracking, and behavior management.

ParentSquare
A unified communication platform for schools, enabling parent-teacher messaging, announcements, and engagement tools.

Remind
A messaging platform for schools that facilitates communication between teachers, students, and parents via text or app notifications.

Brightwheel
A childcare and preschool management app handling attendance, billing, and parent communication.
55 Metrics
Launch Best-in-Class Traditional Schools Company Business Intelligence in Just 48 Hours
SER
Student Enrollment Rate – The percentage of eligible students who enroll in a school or educational program.
AR
Attendance Rate – The percentage of days students are present in school out of the total instructional days.
TSR
Teacher-Student Ratio – The number of students per teacher, indicating class size and potential learning support.
GPA
Academic Performance (GPA) – A measure of students’ academic achievement based on their average grades across subjects.
EP
Extracurricular Participation – The percentage of students engaged in non-academic activities like sports, clubs, and arts programs.
PER
Parent Engagement Rate – The level of parental involvement in school activities, meetings, and student learning.
GR
Graduation Rate – The percentage of students who successfully complete their education and earn a diploma.
DR
Dropout Rate – The percentage of students who leave school before completing their education.
CUR
Classroom Utilization Rate – The percentage of time classrooms are occupied for instructional activities.
CSAT
Student Satisfaction Score (CSAT) – A measure of students’ overall satisfaction with their learning experience and school environment.
TPE
Teacher Performance Evaluation – An assessment of teachers’ effectiveness based on student outcomes, observations, and feedback.
DI
Disciplinary Incidents – The number of reported behavioral issues requiring intervention or disciplinary action.
SBUR
School Budget Utilization Rate – The percentage of allocated funds effectively spent on educational resources and operations.
TUR
Technology Usage Rate – The extent to which digital tools and technology are integrated into learning and administration.
CSAT
Parent Satisfaction Score (CSAT) – A measure of parents’ satisfaction with their child’s education and school experience.
81 Charts
Launch Best-in-Class Traditional Schools Company Business Intelligence in Just 48 Hours
Enrollment by Grade Level
Displays the number of students enrolled in each grade to analyze distribution trends.
Attendance by Grade Level
Tracks student attendance trends across different grade levels over time.
Ratio by Grade
Compares teacher-student ratios across grade levels to assess classroom capacity and resource allocation.
Average GPA by Grade
Shows academic performance trends by tracking average GPA across grade levels.
Participation Rate by Activity
Visualizes student involvement in extracurricular activities, highlighting the most popular programs.
Engagement by Channel
Compares parent and student engagement across communication platforms like email, portals, and events.
Graduation Rate by Year
Tracks graduation rate trends over multiple years to evaluate long-term performance.
Dropout Rate by Grade
Displays student dropout rates for each grade level to identify at-risk periods.
CSAT by Grade Level
Compares student satisfaction scores across grade levels to gauge overall experience.
Utilization Rate by Room
Highlights classroom usage efficiency, identifying underutilized or overcrowded spaces.
Incidents by Grade
Tracks disciplinary incidents by grade level to identify behavioral trends.
Budget Usage by Category
Breaks down school budget spending across different expense categories.
Usage Rate by Device Type
Displays the frequency of technology usage by device type, such as tablets, laptops, and desktops.
CSAT by Grade Level
Measures and compares student satisfaction levels across different grade levels.
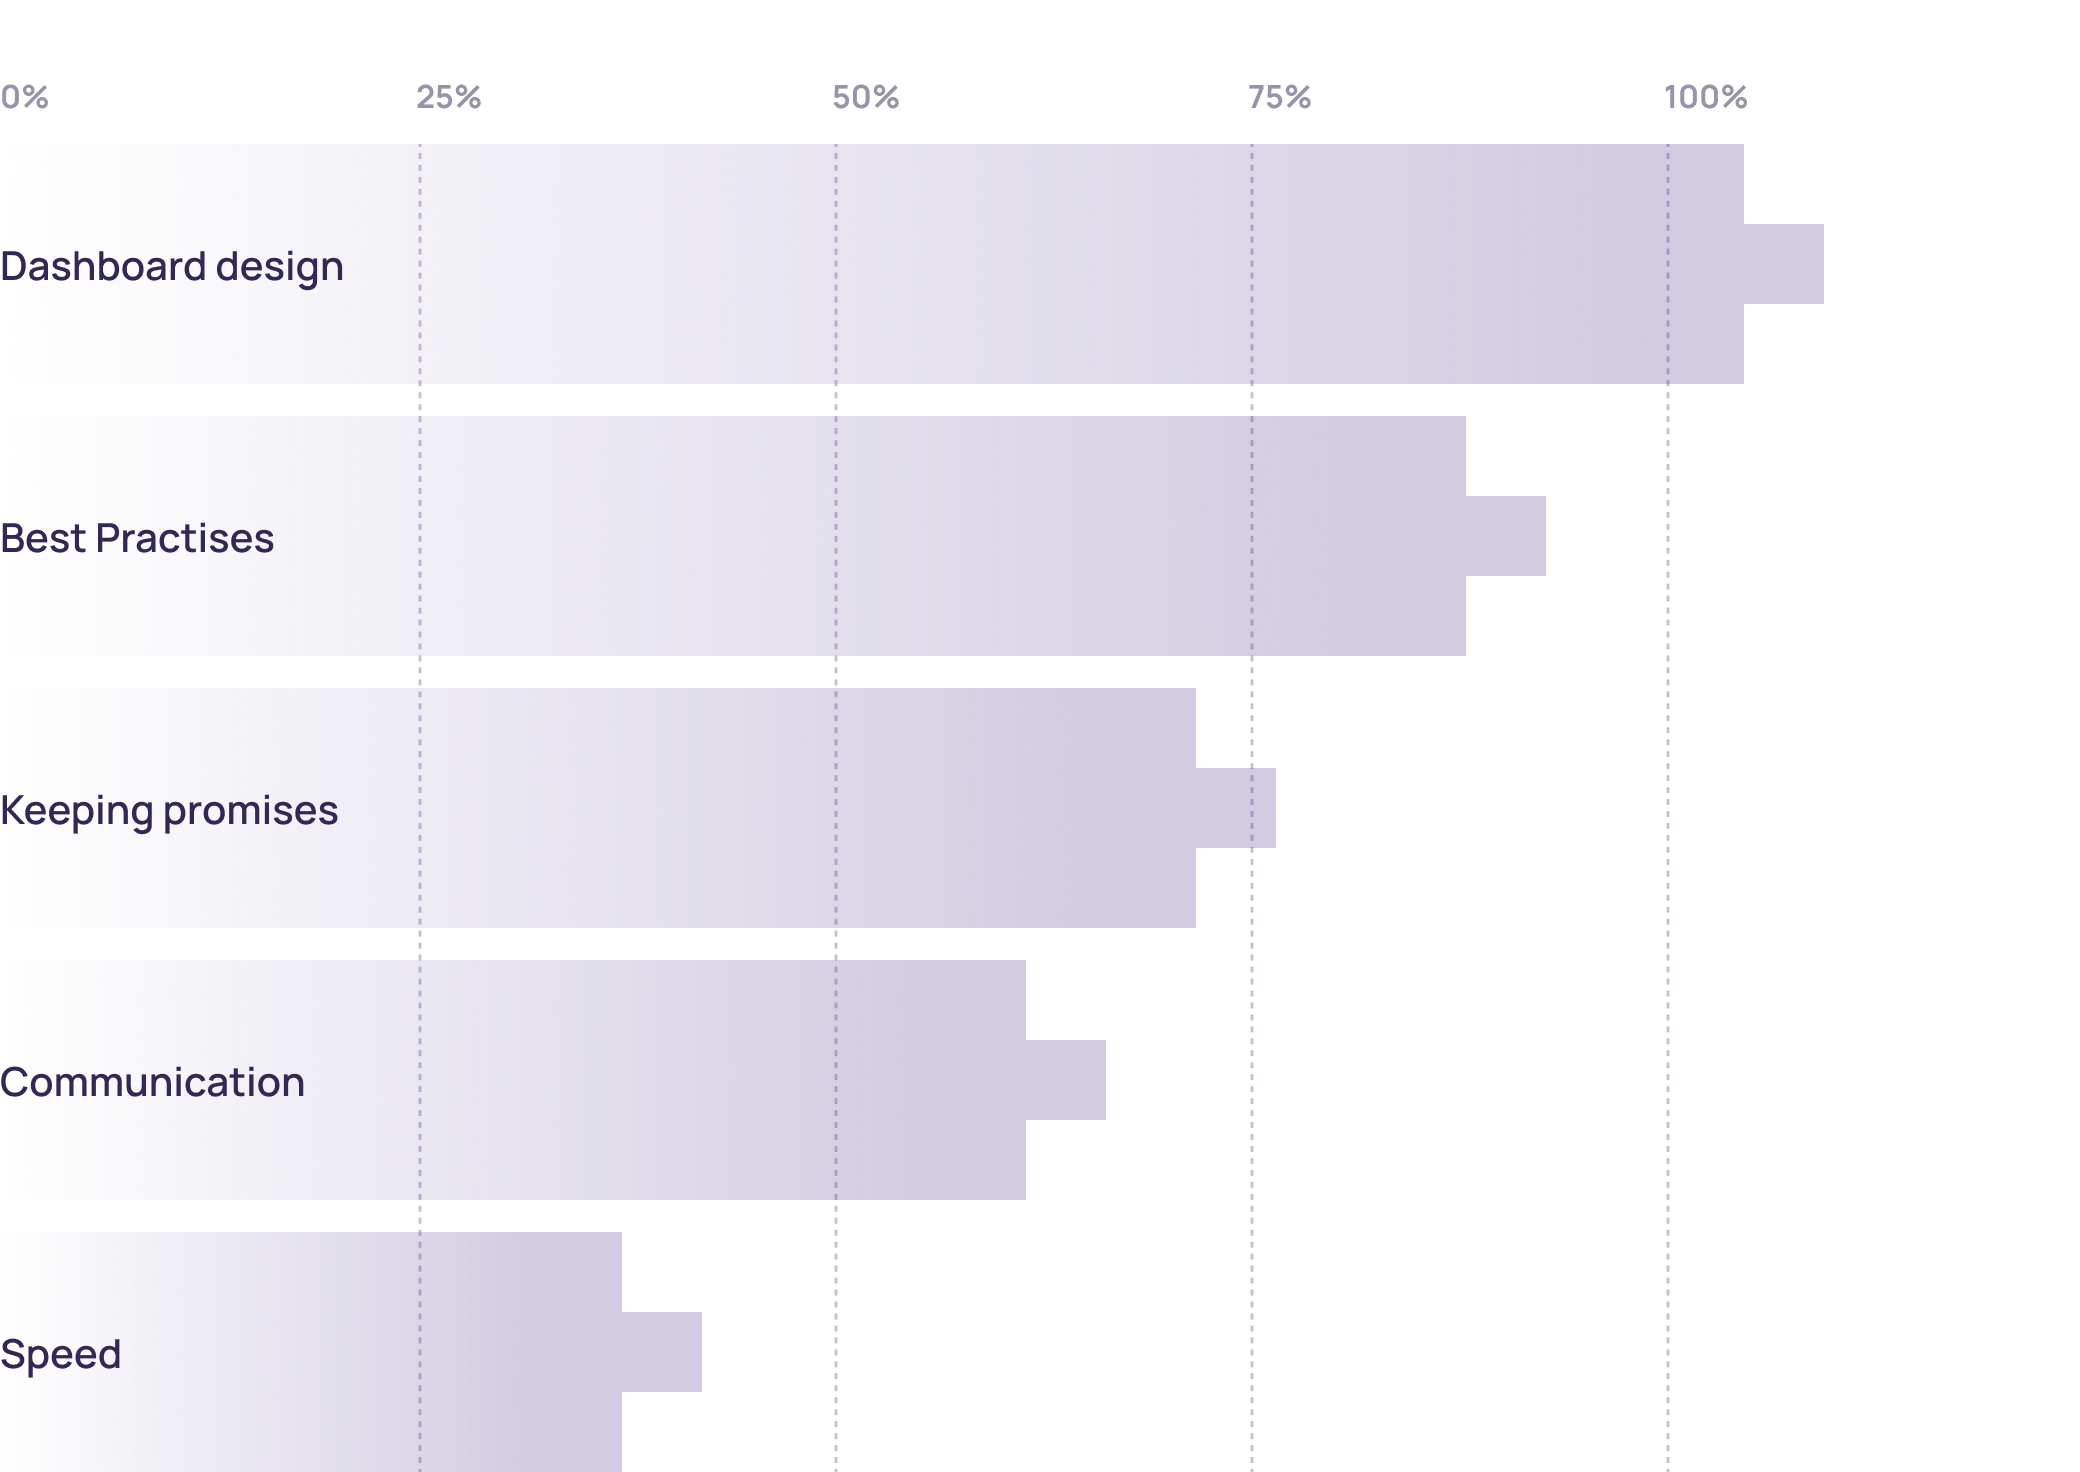
Why customers love us (>100 review)
We’ve identified the top five reasons why our clients choose to work with us and continue partnering with us for years.