Launch Best-in-Class Supply Chain and Storage Business Intelligence in Just 48 Hours
13
Data Sources
51
Metrics / KPIs
84
Charts
2
AI decision making assistants
Launch Best-in-Class Supply Chain and Storage Business Intelligence in Just 48 Hours
13
Data Sources
51
Metrics / KPIs
84
Charts
2
AI decision making assistants
Are we correctly picking items for orders?
Are our freight bills accurate and error-free?
How often are orders delivered without issues?
How quickly are we fulfilling customer orders?


Virtual Show Room
If you want to see how top supply chain and storage companies use data to streamline logistics and boost efficiency, join our showroom session. We’ll walk you through the platforms they rely on — like WMS, TMS, ERP systems, and Power BI — and show how they integrate data across inventory, transportation, and warehouse operations. Together, we’ll explore critical metrics like inventory turnover, order accuracy, dock-to-stock time, and OTIF (on-time, in-full) rates, and review real dashboards used for supply chain visibility and performance tracking. By the end of the session, we’ll outline a prototype decision-making system tailored to your operational needs.
Best Practice Data Stack
At Data Never Lies, we know that in supply chain and storage operations, every decision depends on timely, accurate data. That’s why we build robust analytics systems using tools like WMS, TMS, ERP platforms, and Power BI — designed to track key metrics such as inventory accuracy, order cycle time, fill rates, and OTIF performance. From monitoring warehouse efficiency to optimizing transportation routes and supplier reliability, we create scalable data stacks that turn complex logistics into clear, actionable insights. With our support, your data isn’t just connected — it’s transformed into a strategic advantage that drives efficiency, cost savings, and customer satisfaction.
13 Data Sources
Launch Best-in-Class Supply Chain and Storage Company Business Intelligence in Just 48 Hours

Manhattan Associates
Supply chain software specializing in warehouse, transportation, and inventory management for enhanced operational efficiency.

Blue Yonder
An AI-driven supply chain platform offering end-to-end planning, logistics, and execution capabilities.

Oracle Primavera
A project scheduling and portfolio management software for planning, managing, and optimizing large-scale construction projects.

SAP
SAP ERP is an enterprise resource planning software that integrates core business processes like finance, supply chain, and operations.

Kinaxis RapidResponse
A cloud-based solution enabling real-time supply chain visibility and scenario planning for faster decision-making.

E2open
A connected supply chain platform integrating procurement, manufacturing, and distribution for improved collaboration and efficiency.

Logility Voyager Solutions
A supply chain optimization platform focusing on demand planning, inventory management, and logistics efficiency.

HighJump
Warehouse management software enhancing inventory tracking, order fulfillment, and supply chain visibility.

Fishbowl Inventory
Inventory management software tailored for small and medium-sized businesses to track and manage stock efficiently.

Softeon
A flexible supply chain software platform offering advanced warehouse management and order fulfillment solutions.

Infor ERP
Industry-specific ERP software offering cloud-based tools for finance, supply chain, and production management.

Epicor
A flexible ERP system tailored for manufacturing and distribution industries to streamline operations and drive growth.
Kinaxis RapidResponse
51 Metrics
Launch Best-in-Class Supply Chain and Storage Company Business Intelligence in Just 48 Hours
OFCT
Order Fulfillment Cycle Time: Measures the time from order placement to customer delivery, reflecting supply chain efficiency.
IA
Inventory Accuracy: The percentage of inventory records matching actual stock levels, indicating proper tracking and management.
POR
Perfect Order Rate: The percentage of orders delivered without errors, delays, or defects, showcasing operational precision.
SCCT
Supply Chain Cycle Time: The total time required to complete the entire supply chain process, from order receipt to delivery.
FBA
Freight Bill Accuracy: The percentage of error-free freight invoices, ensuring correct shipping charges and documentation.
OPA
Order Picking Accuracy: The percentage of orders picked correctly in the warehouse, affecting fulfillment quality and customer satisfaction.
ITR
Inventory Turnover Rate: Measures how frequently inventory is sold and replenished over a given period, reflecting demand and efficiency.
SCCPOS
Supply Chain Cost as a Percentage of Sales: The ratio of supply chain expenses to total sales revenue, assessing cost efficiency.
OTSR
On-Time Shipping Rate: The percentage of shipments dispatched within the promised timeframe, indicating logistical reliability.
WC
Warehousing Costs: Total expenses associated with storage, including labor, utilities, and space rental, impacting overall profitability.
ROR
Rate of Return: The percentage of delivered items returned by customers, often due to defects, mismatches, or dissatisfaction.
DR
Damage Rate: The proportion of products damaged during transit or storage, affecting costs and customer satisfaction.
SR
Stockout Rate: The percentage of time products are unavailable for customer demand, impacting sales and brand reliability.
OCTV
Order Cycle Time Variability: Fluctuations in the time taken to process and deliver orders, affecting supply chain predictability.
84 Charts
Launch Best-in-Class Supply Chain and Storage Company Business Intelligence in Just 48 Hours
Cycle Time Over Time
Tracks changes in the average time required to complete a process or task over a specific period.
Inventory Accuracy Percentage
Displays trends in the accuracy of inventory records compared to actual stock levels over time.
Perfect Order Percentage
Visualizes changes in the percentage of orders delivered without errors, delays, or issues across a timeframe.
Cycle Time Over Time
Highlights trends in the duration of key operational cycles, reflecting process efficiency improvements or delays.
Accuracy Over Time
Monitors changes in accuracy metrics, such as order picking or data reliability, over a defined period.
Picking Accuracy Percentage
Tracks trends in the percentage of orders picked accurately from the warehouse over time.
Backorder Rate Over Time
Displays fluctuations in the percentage of delayed orders due to insufficient stock over a specified timeframe.
Cost Percentage Over Time
Visualizes changes in supply chain or operational costs as a percentage of total sales over time.
On-Time Shipping Percentage
Displays trends in the percentage of shipments dispatched within the promised delivery time across periods.
Costs Over Time
Tracks fluctuations in specific costs, such as warehousing or shipping, over a defined time.
Return Rate Over Time
Monitors changes in the percentage of customer returns, reflecting product quality and customer satisfaction trends.
Damage Rate Over Time
Visualizes trends in the percentage of products damaged during handling, transit, or storage over time.
Stockout Rate Over Time
Tracks changes in the percentage of time products are unavailable for customer demand over specific intervals.
Cycle Time Variability
Displays fluctuations in the time taken to complete processes, highlighting inconsistency or improvement trends.
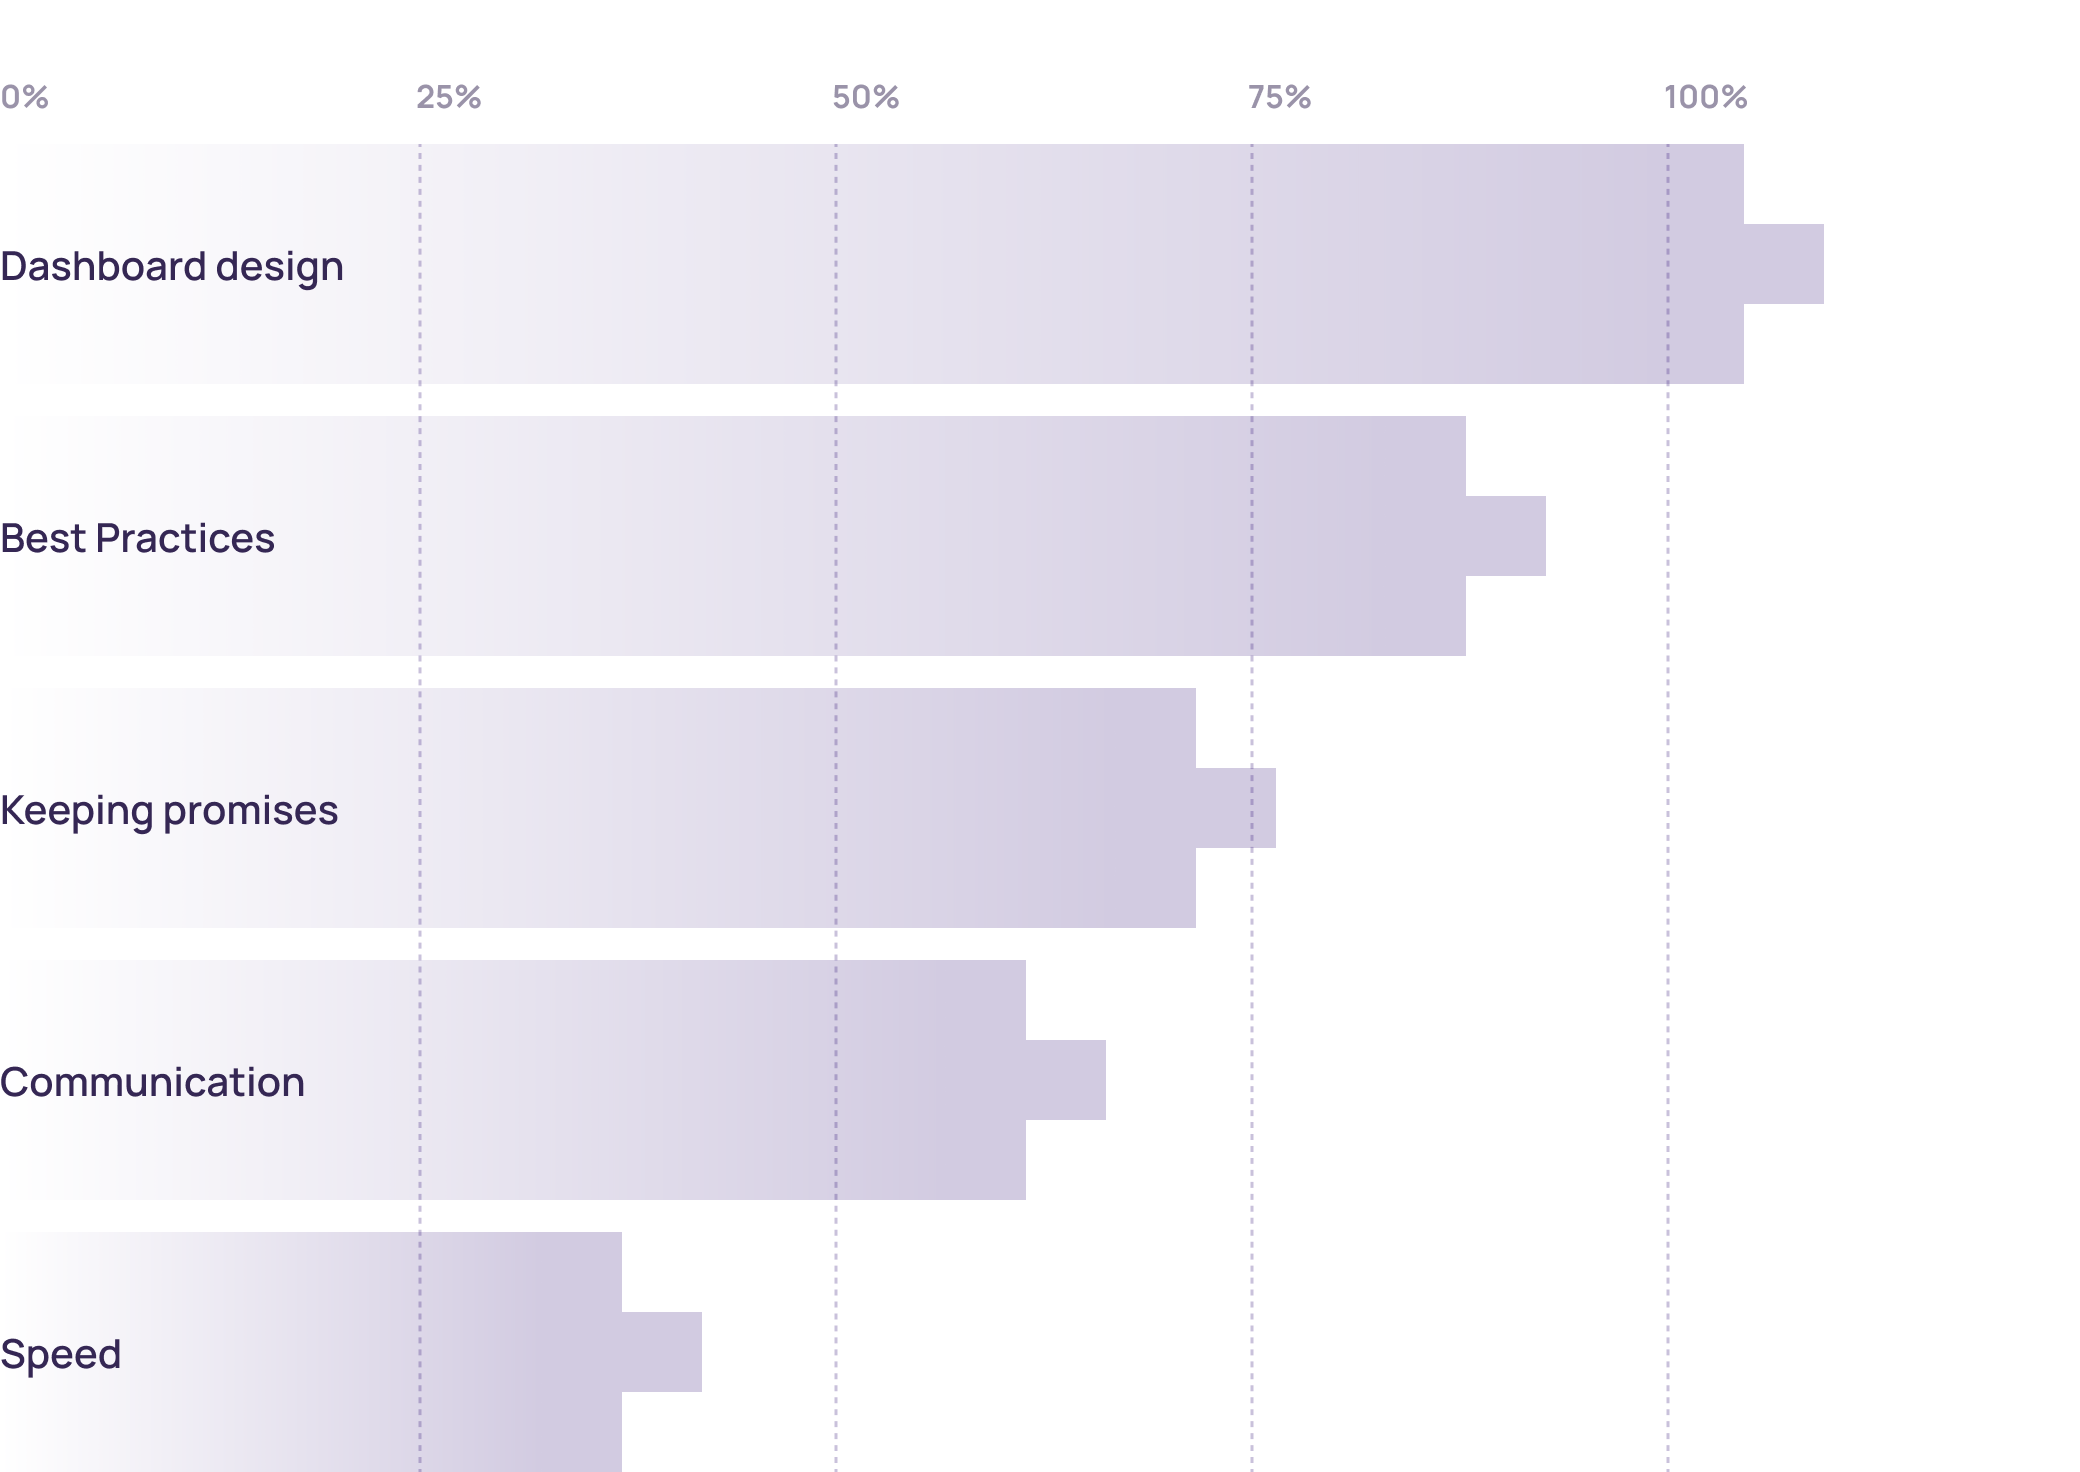
Why customers love us (>100 reviews)
We’ve identified the top five reasons why our clients choose to work with us and continue partnering with us for years.
Our Team
18.
Industry Experts
Our team includes experts with deep knowledge of Supply Chain and Storage industry. These professionals bring years of experience in Supply Chain and Storage, ensuring that we understand your unique challenges and opportunities. Their expertise enables us to deliver tailored BI solutions that address your specific needs and drive meaningful business outcomes.
28.
Visualization Tools
We utilize a wide range of visualization tools to present your data effectively. Our toolkit includes industry-leading software such as Tableau, Power BI, and D3.js, allowing us to create interactive and engaging visualizations. These tools help you explore your data in depth, uncover insights, and communicate findings clearly to stakeholders, facilitating better decision-making across your organization.
50.
Data Engineering Tools
Our engineers use the best tools available to manage and analyze your data. We leverage technologies such as Apache Hadoop, Spark, and SQL databases to handle large volumes of data efficiently. Our data engineering capabilities ensure that your data is cleaned, transformed, and ready for analysis, enabling you to gain accurate and actionable insights from your BI initiatives.
5.
Languages
We offer services in English, Spanish, French, German, and Russian. Our multilingual team ensures that language barriers do not impede your access to top-quality BI solutions. By providing support and documentation in multiple languages, we cater to a diverse client base and ensure effective communication throughout the project lifecycle. This multilingual approach helps us deliver personalized and accessible services to clients worldwide.
24.
Time Zones
Our team operates globally, from Australia to the West Coast, ensuring continuous support. With experts located in multiple time zones, we can provide timely assistance and address your needs around the clock. This global presence ensures that you receive prompt responses to your inquiries, quick resolution of issues, and uninterrupted progress on your BI projects, regardless of your location.
Our Services
Supply Chain and Storage Business Inteligence Outsourcing
Outsource your business intelligence needs to us and focus on your core business activities. Our BI outsourcing services provide you with expert support in managing, analyzing, and interpreting your data. We handle everything from data integration and dashboard creation to advanced analytics and reporting, ensuring that you can leverage data insights without the need for in-house expertise. This allows you to concentrate on strategic initiatives while we manage your BI functions efficiently.
Project Length Starting from 1 Week
Flexible project durations to fit your needs. Whether you require a quick, focused engagement or a long-term partnership, we can tailor our services to match your timeline. Our agile approach allows us to deliver high-quality BI solutions within short timeframes, ensuring that you can address pressing business challenges and capitalize on opportunities promptly.
Educational Programs on Decision-Making
Improve your decision-making skills with our specialized educational programs. Our programs are designed to equip you and your team with the knowledge and tools needed to make data-driven decisions confidently. Through workshops, training sessions, and seminars, we cover topics such as data analysis techniques, interpreting BI reports, and applying insights to business strategies. These educational initiatives help you build a data-centric culture within your organization, empowering you to make better decisions and drive success.