Launch Best-in-Class Retail Business Intelligence in Just 48 Hours
109
Data Sources
48
Metrics / KPIs
93
Charts
9
AI decision making assistants
Launch Best-in-Class Retail Business Intelligence in Just 48 Hours
109
Data Sources
48
Metrics / KPIs
93
Charts
9
AI decision making assistants
Which regions contribute the most to total revenue?
What percentage of in-store visitors make a purchase?
Which customer segments contribute the most revenue across regions?


Virtual Show Room
If you want to see how top retail companies use data to boost sales, manage inventory, and enhance customer experience, join our showroom session. We’ll walk you through the platforms they rely on — like Shopify, Oracle Retail, Lightspeed, and Power BI — and show how they integrate data across POS systems, eCommerce, supply chain, and customer loyalty programs. Together, we’ll explore key metrics such as sales per square foot, inventory turnover, average transaction value, and customer lifetime value, and review real dashboards used for merchandising, demand forecasting, and store performance. By the end of the session, we’ll outline a tailored decision-making system built around your retail operations.
Best Practice Data Stack
At Data Never Lies, we understand that in retail, success depends on fast, data-driven decisions across stores, channels, and customer touchpoints. That’s why we build scalable analytics solutions using tools like Shopify, Oracle Retail, Lightspeed, and Power BI — tailored to unify sales, inventory, and customer data. From tracking key metrics like sell-through rate, inventory turnover, average basket size, and customer lifetime value to enabling demand forecasting and store performance analysis, we help retail teams move from gut feeling to strategic action. With our expertise, your data isn’t just organized — it becomes a powerful driver of profitability, efficiency, and customer loyalty.
109 Data Sources
Launch Best-in-Class Retail Company Business Intelligence in Just 48 Hours

Blue Yonder
An AI-driven supply chain platform offering end-to-end planning, logistics, and execution capabilities.

Magento (Adobe Commerce)
A powerful, customizable eCommerce solution designed for enterprise-level businesses with advanced features and scalability.

Oracle Primavera
A project scheduling and portfolio management software for planning, managing, and optimizing large-scale construction projects.

SAP
SAP ERP is an enterprise resource planning software that integrates core business processes like finance, supply chain, and operations.

BigCommerce Enterprise
A scalable eCommerce solution providing API-driven flexibility, omnichannel selling, and enterprise-grade features for large businesses.

Aptos
A retail technology platform offering POS, inventory management, and customer engagement solutions for omnichannel retail operations.

NCR
A provider of retail, banking, and hospitality technology solutions, including POS systems, self-checkout, and payment processing.

Lightspeed Enterprise
A cloud-based POS and retail management system designed for multi-location businesses, offering inventory and sales tracking.

Clover
A point-of-sale system providing payment processing, inventory management, and business analytics for retailers and restaurants.

Verifone
A global provider of secure payment terminals, POS systems, and transaction processing solutions.

RetailNext
An analytics platform using in-store sensors and AI to track customer behavior, foot traffic, and sales performance.

ShopperTrak
A retail analytics solution that tracks foot traffic and conversion rates to optimize store performance.
BigCommerce Enterprise
48 Metrics
Launch Best-in-Class Retail Company Business Intelligence in Just 48 Hours
TSR
Total Sales Revenue – The total income generated from sales of products or services within a specific period.
SSSG
Same-Store Sales Growth – Measures revenue change for existing locations, excluding new stores, to assess business performance.
ITR
Inventory Turnover Rate – The frequency at which inventory is sold and replaced within a given period.
CSA
Customer Segmentation Analysis – Dividing customers into groups based on behavior, demographics, or preferences for targeted marketing.
OCR
Omnichannel Conversion Rate – The percentage of customers completing purchases across multiple sales channels, including online and in-store.
CLTV
Customer Lifetime Value (CLTV) – The total predicted revenue a business expects from a customer over their entire relationship.
ABS
Average Basket Size – The average number of items purchased per transaction, reflecting customer purchasing behavior.
ECAR
E-commerce Cart Abandonment Rate – The percentage of online shoppers who add items to their cart but don’t complete the purchase.
EPR
Employee Productivity Rate – Measures efficiency by evaluating output per employee within a specific time frame.
MROI
Marketing ROI – The return on investment for marketing activities, calculated by comparing revenue to marketing costs.
NPS
Net Promoter Score (NPS) – A customer loyalty metric indicating the likelihood of customers recommending a business.
ICR
In-Store Conversion Rate – The percentage of store visitors who make a purchase, measuring retail sales effectiveness.
SAR
Stock Availability Rate – The percentage of products available for sale versus total demand, indicating inventory efficiency.
SOE
Supply Chain Efficiency – Assesses how effectively a company manages procurement, production, and distribution processes.
CRR
Customer Retention Rate – The percentage of customers who continue purchasing from a business over a specific period.
Sales Revenue Over Time
Tracks revenue trends over a specific period, helping identify seasonal patterns and growthю
Growth Rate by Store
Compares revenue growth across different store locations to evaluate performance.
Turnover Rate by Product Category
Displays how frequently inventory is sold and replaced for each product category.
Segment Revenue by Region
Visualizes revenue distribution across geographic regions, highlighting high- and low-performing areas.
Conversion Rate by Channel
Compares sales conversion effectiveness across marketing and sales channels like online, in-store, and social media.
CLTV by Segment
Shows the projected lifetime value of customers segmented by behavior, demographics, or purchase patterns.
Basket Size by Store
Compares the average number of items per transaction across different store locations.
Abandonment Rate by Product
Displays the percentage of online shoppers leaving their cart without purchasing specific products.
Revenue per Employee
Measures business efficiency by analyzing revenue generated per employee.
NPS by Store
Compares customer satisfaction and loyalty scores across store locations.
Conversion Rate by Store
Displays how effectively each store converts visitors into paying customers.
Stock Availability by Store
Shows the proportion of in-stock versus out-of-stock items for each store.
On-Time Delivery Rate
Measures the percentage of orders delivered within the promised timeframe.
Retention Rate by Segment
Tracks customer retention trends over time for different customer segments..
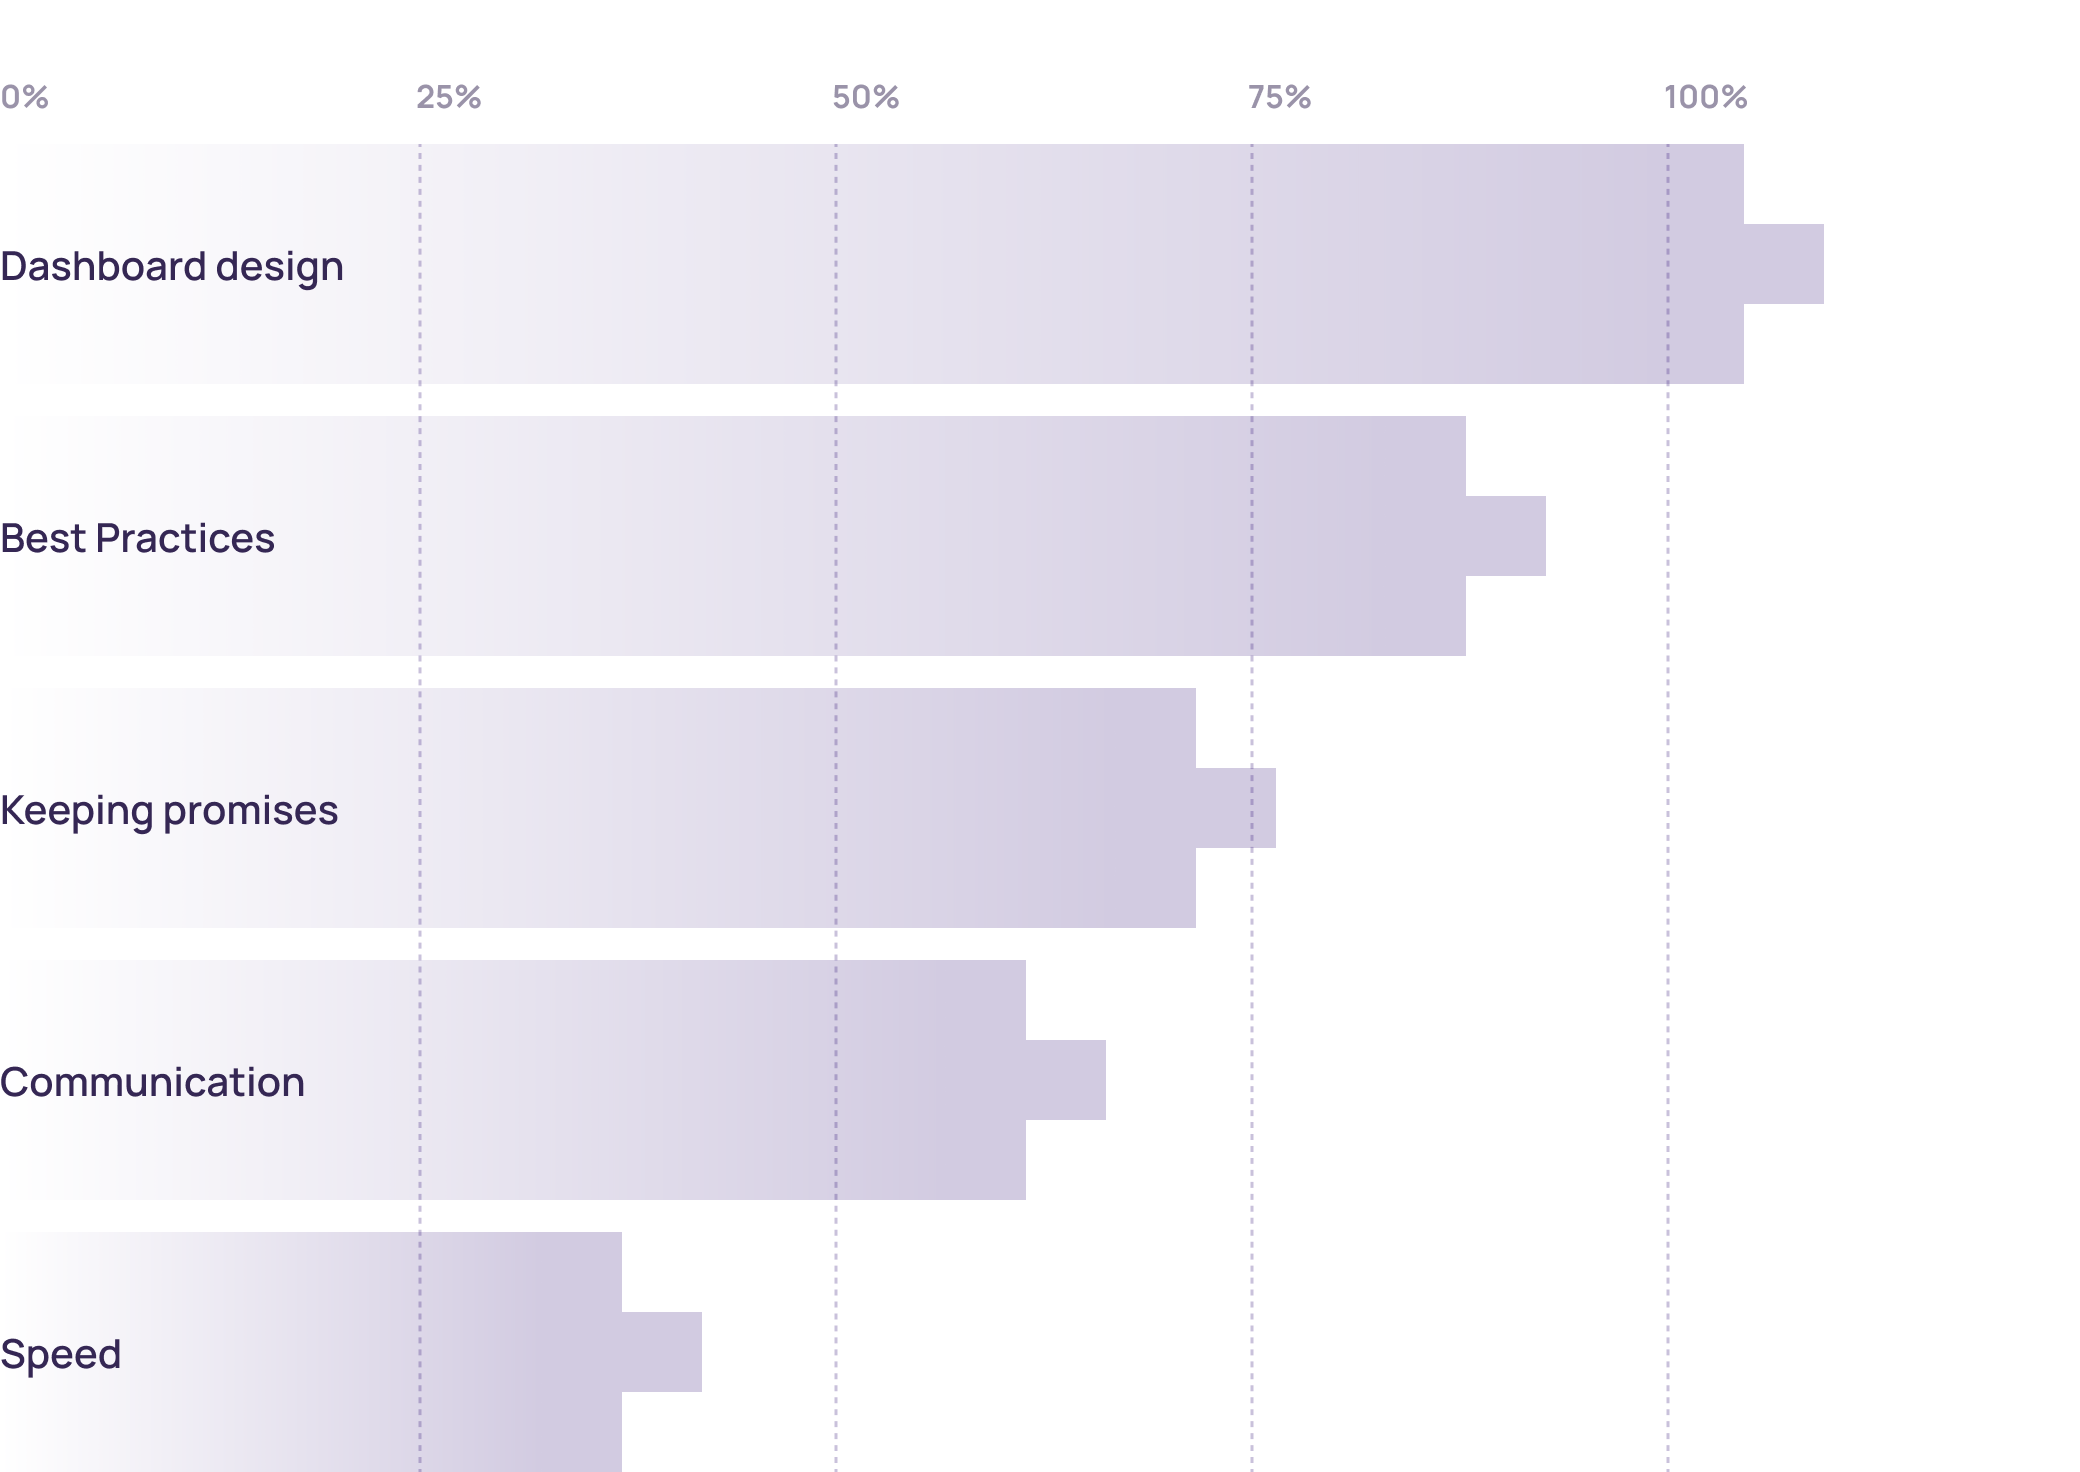
Why customers love us (>100 reviews)
We’ve identified the top five reasons why our clients choose to work with us and continue partnering with us for years.
Our Team
18.
Industry Experts
Our team includes experts with deep knowledge of Retail industry. These professionals bring years of experience in Retail, ensuring that we understand your unique challenges and opportunities. Their expertise enables us to deliver tailored BI solutions that address your specific needs and drive meaningful business outcomes.
28.
Visualization Tools
We utilize a wide range of visualization tools to present your data effectively. Our toolkit includes industry-leading software such as Tableau, Power BI, and D3.js, allowing us to create interactive and engaging visualizations. These tools help you explore your data in depth, uncover insights, and communicate findings clearly to stakeholders, facilitating better decision-making across your organization.
50.
Data Engineering Tools
Our engineers use the best tools available to manage and analyze your data. We leverage technologies such as Apache Hadoop, Spark, and SQL databases to handle large volumes of data efficiently. Our data engineering capabilities ensure that your data is cleaned, transformed, and ready for analysis, enabling you to gain accurate and actionable insights from your BI initiatives.
5.
Languages
We offer services in English, Spanish, French, German, and Russian. Our multilingual team ensures that language barriers do not impede your access to top-quality BI solutions. By providing support and documentation in multiple languages, we cater to a diverse client base and ensure effective communication throughout the project lifecycle. This multilingual approach helps us deliver personalized and accessible services to clients worldwide.
24.
Time Zones
Our team operates globally, from Australia to the West Coast, ensuring continuous support. With experts located in multiple time zones, we can provide timely assistance and address your needs around the clock. This global presence ensures that you receive prompt responses to your inquiries, quick resolution of issues, and uninterrupted progress on your BI projects, regardless of your location.
Our Services
Retail Business Inteligence Outsourcing
Outsource your business intelligence needs to us and focus on your core business activities. Our BI outsourcing services provide you with expert support in managing, analyzing, and interpreting your data. We handle everything from data integration and dashboard creation to advanced analytics and reporting, ensuring that you can leverage data insights without the need for in-house expertise. This allows you to concentrate on strategic initiatives while we manage your BI functions efficiently.
Project Length Starting from 1 Week
Flexible project durations to fit your needs. Whether you require a quick, focused engagement or a long-term partnership, we can tailor our services to match your timeline. Our agile approach allows us to deliver high-quality BI solutions within short timeframes, ensuring that you can address pressing business challenges and capitalize on opportunities promptly.
Educational Programs on Decision-Making
Improve your decision-making skills with our specialized educational programs. Our programs are designed to equip you and your team with the knowledge and tools needed to make data-driven decisions confidently. Through workshops, training sessions, and seminars, we cover topics such as data analysis techniques, interpreting BI reports, and applying insights to business strategies. These educational initiatives help you build a data-centric culture within your organization, empowering you to make better decisions and drive success.