Launch Best-in-Class Property Management and Coworking Spaces Business Intelligence in Just 48 Hours
28
Data Sources
51
Metrics / KPIs
56
Charts
1
AI decision making assistants
Launch Best-in-Class Property Management and Coworking Spaces Business Intelligence in Just 48 Hours
28
Data Sources
51
Metrics / KPIs
56
Charts
1
AI decision making assistants
What are the average operating costs for each managed property?
How efficiently are spaces generating revenue based on their size?
Which properties or spaces have the highest vacancy rates?


Virtual Show Room
If you want to see how leading property management and coworking space operators use data to maximize occupancy and streamline operations, join our showroom session. We’ll walk you through the platforms they rely on — such as Yardi, OfficeRnD, HubSpot, and Power BI — and show how they integrate data across leasing, maintenance, member engagement, and financial reporting. Together, we’ll explore key metrics like occupancy rate, churn, revenue per square foot, booking frequency, and maintenance turnaround time, and review dashboards used for performance tracking and space optimization. By the end of the session, we’ll outline a tailored decision-making system built around your properties and business model.
Best Practice Data Stack
At Data Never Lies, we understand that property managers and coworking space operators need real-time visibility to optimize occupancy, revenue, and tenant satisfaction. That’s why we build scalable analytics solutions using tools like Yardi, OfficeRnD, Salesforce, and Power BI — tailored to unify data across leasing, maintenance, booking, and member engagement. From tracking key metrics like occupancy rates, revenue per square foot, churn, average lease term, and space utilization, to automating financial and operational reports, we help you turn day-to-day data into strategic insight. With our expertise, your data isn’t just structured — it becomes a powerful tool for driving growth and delivering better tenant experiences.
28 Data Sources
Launch Best-in-Class Property Management and Coworking Spaces Company Business Intelligence in Just 48 Hours

Optix App
A coworking and flexible workspace management platform that streamlines bookings, billing, and member engagement.

Yardi Kube
A property management software for coworking spaces, offering lease management, billing, and operational automation.

Spacebring
A workspace management solution designed for coworking spaces, handling bookings, memberships, and access control.

AppFolio
A cloud-based property management software for rental properties, including accounting, leasing, and tenant screening.

Yardi
A comprehensive property management and real estate investment software solution.

ResMan
A property management platform focused on multifamily properties, providing accounting, leasing, and operational management tools.

Propertyware
A property management solution tailored for single-family rental portfolios, offering leasing, maintenance, and financial reporting.
Entrata
A property management software providing leasing, payments, and resident engagement tools for multifamily housing.

Hemlane
A property management software designed for independent landlords, handling leasing, maintenance, and rent collection.
Rent Manager
A customizable property management solution for residential and commercial properties, featuring accounting, tenant tracking, and maintenance tools.
51 Metrics
Launch Best-in-Class Property Management and Coworking Spaces Company Business Intelligence in Just 48 Hours
OR
Occupancy Rate – The percentage of rented units in a property, indicating demand, revenue stability, and overall leasing effectiveness.
VR
Vacancy Rate – The percentage of unoccupied rental units, reflecting market conditions, leasing performance, and potential lost income opportunities.
ARR
Average Rental Revenue – The total rental income earned per occupied unit, providing insights into pricing strategy and financial performance.
LRR
Lease Renewal Rate – The percentage of tenants choosing to renew leases, indicating tenant satisfaction, property appeal, and lease management success.
RPSF
Revenue per Square Foot – The rental income generated per square foot, used to evaluate property profitability and space utilization efficiency.
OEPP
Operating Expenses per Property – Total costs associated with managing and maintaining a property, impacting net income and overall financial performance.
CRR
Client Retention Rate – The percentage of tenants retained over a period, showing lease renewal success and long-term property stability.
NOI
Net Operating Income (NOI) – Revenue minus operating expenses, providing a clear measure of a property’s profitability before financing costs.
ALS
Average Length of Stay – The typical duration tenants occupy a unit, influencing turnover costs, vacancy rates, and lease renewal strategies.
RGR
Revenue Growth Rate – The percentage increase in rental income over time, measuring financial performance and investment success.
MRRT
Maintenance Request Resolution Time – The average time taken to resolve maintenance issues, affecting tenant satisfaction and property reputation.
EUP
Energy Usage per Property – Total energy consumption per building, impacting operational costs, sustainability goals, and efficiency improvements.
LG
Leads Generated – The number of potential tenants acquired through marketing efforts, indicating advertising effectiveness and demand.
MROI
Marketing ROI – The financial return on marketing investments, measuring campaign success and cost-effectiveness in attracting tenants.
PMP
Profit Margin per Property – The percentage of revenue remaining after expenses, reflecting overall profitability and financial health of a property.
56 Charts
Launch Best-in-Class Property Management and Coworking Spaces Company Business Intelligence in Just 48 Hours
Occupancy Rate by Property Type
Compares occupancy rates across different property types, highlighting demand trends and leasing performance.
Vacancy Rate by Property Type
Shows vacancy percentages for various property types, identifying underperforming categories and market opportunities.
Rental Revenue Over Time
Tracks rental income fluctuations, revealing revenue trends, seasonal impacts, and financial performance.
Renewal Rate by Space Type
Displays lease renewal rates for different space types, indicating tenant retention and lease management effectiveness.
Revenue per Square Foot by Property
Compares income generated per square foot across properties, assessing efficiency and profitability.
Operating Expenses Over Time
Illustrates changes in property costs, identifying expense trends and cost-saving opportunities.
Retention Rate by Property
Tracks tenant retention rates by property, highlighting customer loyalty and lease renewal success.
NOI Over Time
Shows net operating income trends, measuring financial health and profitability shifts.
Length of Stay by Property Type
Compares average tenant stay duration across property types, revealing turnover trends and lease stability.
Revenue Growth Over Time
Tracks rental income growth, indicating financial progress and investment performance.
Energy Usage by Property
Tracks energy consumption trends across properties, supporting cost management and sustainability efforts.
Leads by Channel
Compares lead generation sources, identifying the most effective marketing channels.
ROI by Campaign
Evaluates marketing campaign returns, showing cost-effectiveness and performance across different strategies.
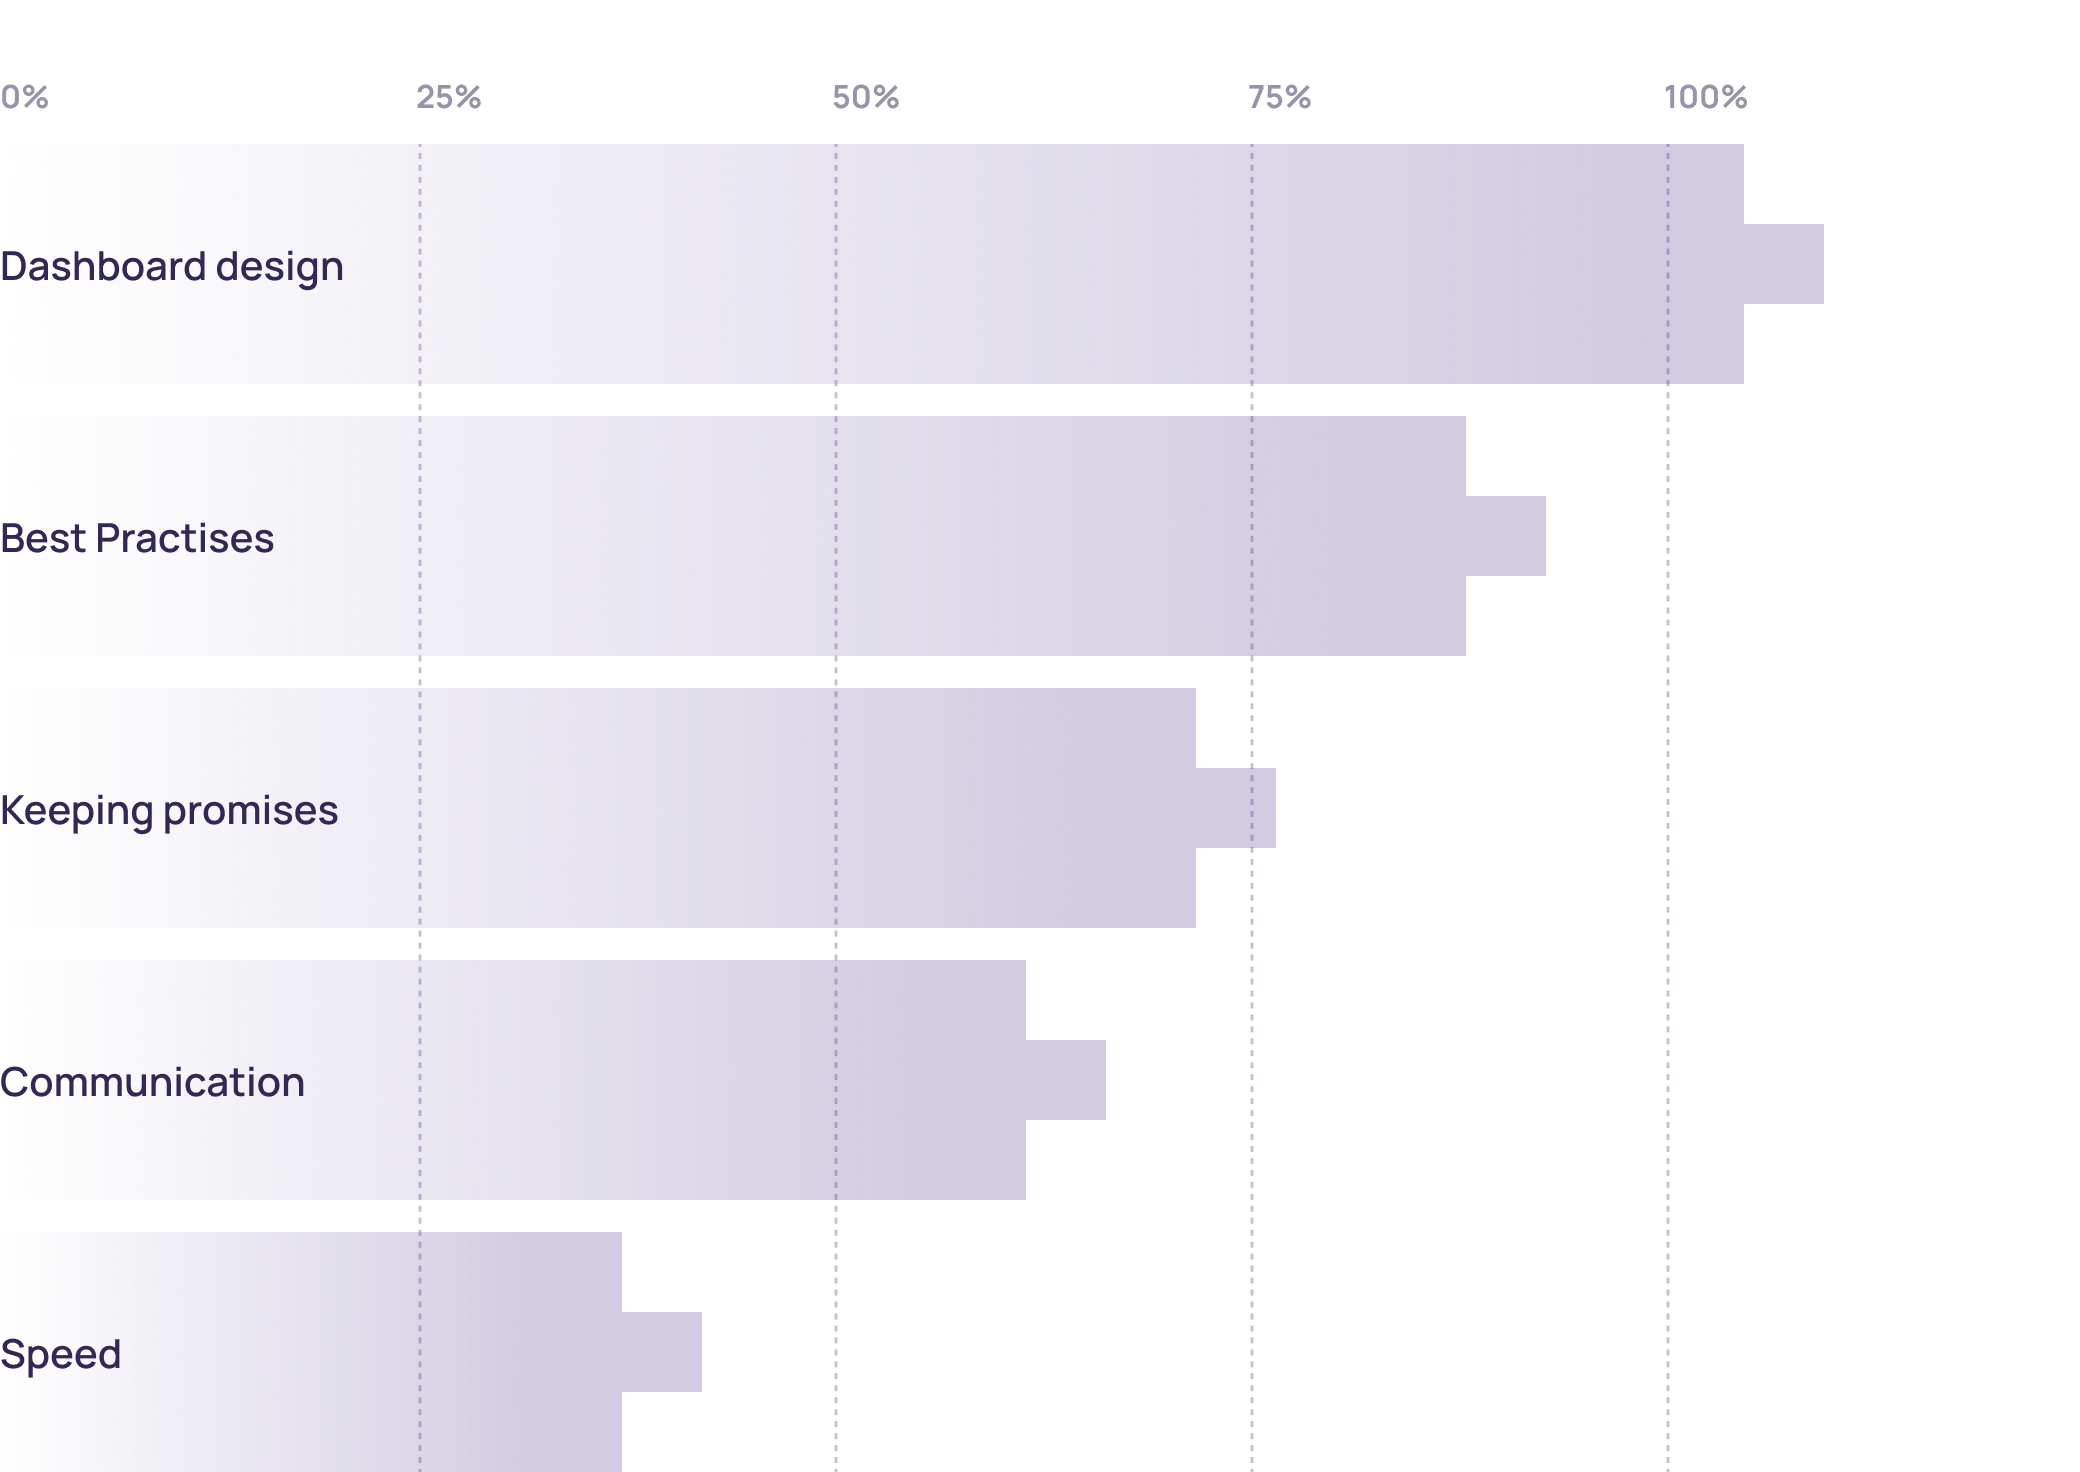
Why customers love us (>100 review)
We’ve identified the top five reasons why our clients choose to work with us and continue partnering with us for years.