Launch Best-in-Class Online Schools Business Intelligence in Just 48 Hours
48
Data Sources
46
Metrics / KPIs
57
Charts
1
AI decision making assistants
Launch Best-in-Class Online Schools Business Intelligence in Just 48 Hours
48
Data Sources
46
Metrics / KPIs
57
Charts
1
AI decision making assistants
Which online courses are generating the most revenue?
What percentage of students are completing their online courses?
How many students are actively participating in online courses?


Virtual Show Room
If you want to see how top online schools use data to improve student outcomes and optimize operations, join our showroom session. We’ll walk you through the platforms they rely on — such as Canvas, Moodle, Google Classroom, and Power BI — and show how they integrate data across enrollment, course engagement, assessments, and student support. Together, we’ll explore key metrics like course completion rates, student retention, time-on-task, learner satisfaction, and instructor performance, and review real dashboards used for academic planning and performance monitoring. By the end of the session, we’ll outline a tailored decision-making system designed around your school’s goals and learning model./h5>
Best Practice Data Stack
At Data Never Lies, we understand that online schools rely on data to enhance learning experiences, support students, and scale effectively. That’s why we build tailored analytics systems using platforms like Canvas, Moodle, Google Classroom, and Power BI — designed to track and visualize key data across enrollment, engagement, assessments, and course performance. From monitoring metrics like completion rates, dropout risk, time spent per module, and learner satisfaction, to integrating LMS and CRM data for unified insights, we help education teams turn raw data into meaningful action. With our expertise, your data isn’t just organized — it becomes a powerful tool for improving outcomes and driving growth.
48 Data Sources
Launch Best-in-Class Online Schools Company Business Intelligence in Just 48 Hours

Oracle NetSuite
Oracle NetSuite is a cloud-based enterprise resource planning (ERP) software for managing finances, operations, customer relationships, and e-commerce.
Microsoft Dynamics 365
Microsoft Dynamics 365 is a cloud-based platform integrating CRM and ERP solutions to streamline business operations and customer management.

Salesforce
Salesforce is a cloud-based customer relationship management (CRM) platform enabling businesses to streamline sales, marketing, and service.

SAP
SAP ERP is an enterprise resource planning software that integrates core business processes like finance, supply chain, and operations.

QuickBooks
QuickBooks is accounting software designed to help businesses manage finances, track expenses, create invoices, and generate reports.

Schoology
An LMS focused on K-12 education, offering collaborative tools, assessments, and student progress tracking.

LearnDash
A WordPress-based LMS plugin that enables course creation, quizzes, and student tracking for online learning businesses.

Thinkific
A platform for creating, marketing, and selling online courses, designed for entrepreneurs, businesses, and educators.
Brightspace
A cloud-based LMS designed for higher education and corporate learning, offering personalized learning experiences and analytics.

Canvas
A modern, cloud-based LMS designed for easy course creation, grading, and student engagement in education and corporate training.
Qualtrics
A customer experience management platform for creating surveys and analyzing feedback to drive business decisions.

Google Forms
A free online tool for creating and distributing surveys or forms, with built-in response tracking.

SurveyMonkey
An online survey tool for creating, distributing, and analyzing feedback from customers and employees.

Stripe
Stripe is a payment processing platform enabling businesses to accept online payments, manage subscriptions, and handle financial transactions securely.

PayPal
PayPal is an online payment platform that allows users to send, receive, and manage money securely and globally.
46 Metrics
Launch Best-in-Class Online Schools Company Business Intelligence in Just 48 Hours
ASC
Active Student Count – The total number of students currently enrolled and actively participating in lessons, quizzes, or assignments within a course.
CCR
Course Completion Rate – The percentage of enrolled students who finish all required coursework, assignments, and assessments within a specified timeframe.
DR
Dropout Rate – The percentage of students who enroll but fail to complete a course due to disengagement, difficulty, or other factors.
SET
Student Engagement Time – The average duration students actively interact with course materials, including video lectures, quizzes, assignments, and discussion forums.
CSAT
Feedback Score (CSAT) – A numerical measure of student satisfaction based on survey responses regarding course content, instruction quality, and overall experience.
RPC
Revenue per Course – The total earnings generated from a single course, factoring in enrollments, pricing models, and discounts applied.
TIRT
Technical Issue Resolution Time – The average time required to address and resolve technical issues reported by students, ensuring minimal learning disruptions.
QCR
Quiz/Assignment Completion Rate – The percentage of students who attempt and complete quizzes, assignments, or assessments within the designated deadlines.
MROI
Marketing ROI – The return on investment for marketing efforts, calculated by comparing student enrollment revenue against advertising and promotional expenses.
NPS
Net Promoter Score (NPS) – A metric indicating student loyalty and likelihood to recommend the course, based on survey ratings from detractors, passives, and promoters.
NER
New Enrollment Rate – The percentage of new students enrolling in a course during a specific period, reflecting marketing and outreach effectiveness.
ATCC
Average Time to Complete Course – The typical duration students take from enrollment to course completion, including learning modules, quizzes, and final assessments.
SDU
Student Device Utilization – The distribution and frequency of devices (mobile, tablet, desktop) students use for accessing and engaging with course content.
CER
Content Engagement Rate – The percentage of course materials viewed, interacted with, or completed by students, indicating interest and participation levels.
RGR
Revenue Growth Rate – The percentage increase in course-generated revenue over time, reflecting business performance, student demand, and pricing strategy.
57 Charts
Launch Best-in-Class Online Schools Company Business Intelligence in Just 48 Hours
Active Students by Week
Displays weekly trends in the number of students actively participating in courses over time.
Completion Rate by Course
Compares the percentage of students completing each course, highlighting variations in course engagement and difficulty.
Dropout Rate by Course
Tracks student dropout trends across courses over time, identifying retention challenges in specific courses.
Engagement Time by Week
Shows how much time students spend interacting with course content weekly, indicating engagement trends over time.
Feedback Score by Course
Compares student satisfaction scores across courses, helping assess content quality and instructional effectiveness.
Revenue by Course
Visualizes total revenue generated per course, showing financial performance and enrollment-based income distribution.
Resolution Time by Issue Type
Displays average time taken to resolve different technical issues, highlighting support efficiency.
Assignment Completion by Week
Tracks the percentage of students completing assignments weekly, reflecting course workload and student commitment.
ROI by Campaign
Compares marketing campaign performance by showing revenue generated relative to campaign costs.
NPS by Course
Shows how likely students are to recommend each course based on Net Promoter Score ratings.
Enrollment Rate by Course
Displays the percentage of new enrollments per course, indicating student interest and marketing effectiveness.
Time to Completion by Course
Tracks how long students take to complete different courses, highlighting variations in course duration.
Utilization Rate by Device
Shows the percentage of students using different devices (mobile, tablet, desktop) for course access.
Engagement Rate by Module
Compares student interaction levels across course modules, identifying the most engaging content.
Revenue Growth Over Time
Tracks revenue trends over time, illustrating financial growth and seasonal enrollment patterns.
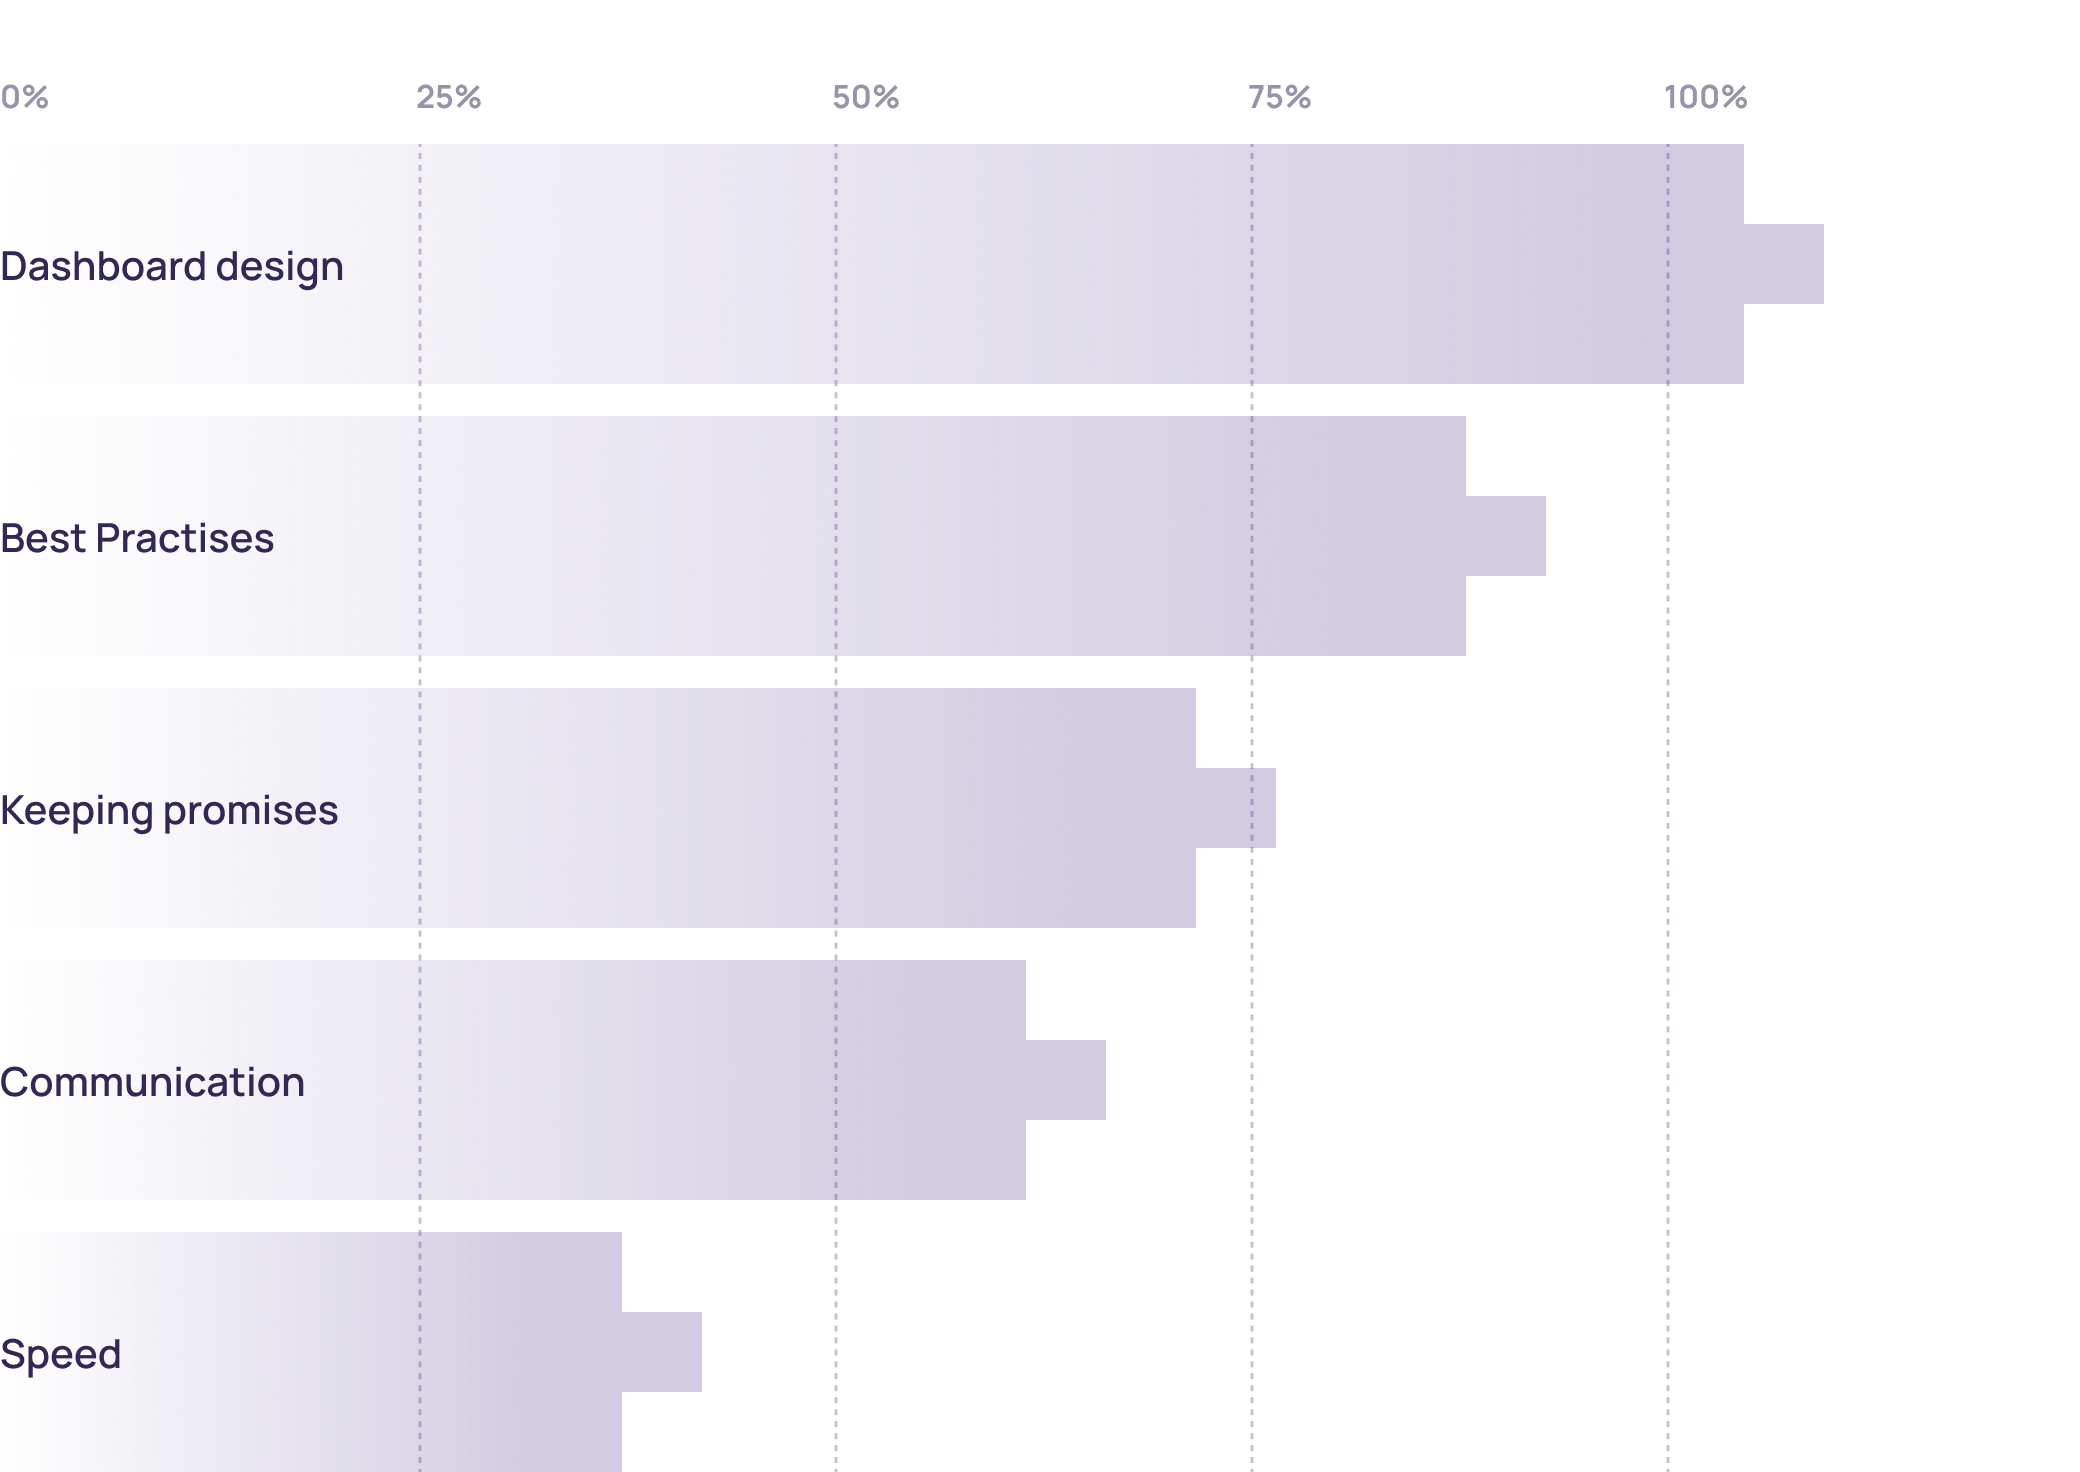
Why customers love us (>100 review)
We’ve identified the top five reasons why our clients choose to work with us and continue partnering with us for years.