Launch Best-in-Class Mobile Apps B2C Business Intelligence in Just 48 Hours
30
Data Sources
88
Metrics / KPIs
93
Charts
3
AI decision making assistants
Launch Best-in-Class Mobile Apps B2C Business Intelligence in Just 48 Hours
30
Data Sources
88
Metrics / KPIs
93
Charts
3
AI decision making assistants
Which in-app purchase items are generating the most revenue?
What percentage of users are returning to our app over time?
How many unique users are actively using our app each day?


Virtual Show Room
If you want to see how top B2C mobile app companies use data to grow users and boost retention, join our showroom session. We’ll walk you through the tools they rely on — like Firebase, Mixpanel, Amplitude, and BigQuery — and show how they track real-time behavior, funnels, and in-app engagement. Together, we’ll explore key metrics such as DAU/MAU, retention cohorts, churn rate, ARPU, and conversion events, and review real dashboards used to guide product updates and marketing spend. By the end of the session, we’ll map out a prototype decision-making system tailored to your app’s goals and growth stage.
Best Practice Data Stack
At Data Never Lies, we understand that for B2C mobile apps, growth depends on knowing exactly how users engage, convert, and stay. That’s why we build scalable analytics systems using tools like Firebase, Amplitude, Mixpanel, and BigQuery — tailored to your app’s lifecycle and goals. From tracking user retention and session frequency to analyzing in-app conversions, churn, and LTV, we turn raw behavioral data into actionable insights. With our expertise, your data isn’t just connected — it’s transformed into a powerful engine for improving UX, boosting engagement, and driving sustainable growth.
30 Data Sources
Launch Best-in-Class Mobile Apps B2C Company Business Intelligence in Just 48 Hours
AppsFlyer
A mobile attribution and marketing analytics platform for tracking app performance and optimizing user acquisition campaigns.
Firebase Analytics
A free analytics tool by Google for tracking app user behavior and engagement across Android and iOS platforms.

Amplitude
Amplitude is a product analytics platform that helps businesses understand user behavior, optimize experiences, and drive growth through data insights.

Mixpanel
Mixpanel is an analytics platform that tracks user interactions with digital products, helping businesses optimize user engagement and retention.

Google Analytics
Google Analytics is a web analytics tool that tracks and reports website traffic, user behavior, and marketing performance.

Adjust
A mobile attribution and analytics platform for optimizing app marketing campaigns and measuring user acquisition efforts.

Branch
A deep linking and mobile attribution platform for improving user experiences and tracking campaign performance.

Singular
A unified marketing analytics platform for tracking campaign ROI, attribution, and user acquisition metrics.

Kochava
A mobile attribution and analytics tool for tracking app installs, in-app events, and optimizing ad campaigns.

Flurry
A mobile app analytics platform for tracking user engagement, retention, and monetization metrics.

Apple App Store
A digital distribution platform for iOS apps, providing analytics, reviews, and user engagement insights.

App Annie
A mobile app intelligence platform offering market data, download statistics, and user insights for app performance analysis.

Sensor Tower
A mobile app analytics and market intelligence tool for tracking app store performance and user acquisition trends.
Data.ai
A platform combining app analytics and market intelligence to optimize app performance and user engagement strategies.
Adjust
88 Metrics
Launch Best-in-Class Mobile Apps B2C Company Business Intelligence in Just 48 Hours
DAU
Daily Active Users (DAU): Number of unique users engaging with an app daily, measuring short-term user activity.
MAU
Monthly Active Users (MAU): Number of unique users engaging with an app monthly, showing long-term audience reach.
RR
Retention Rate: Percentage of users returning to an app after initial use, indicating engagement and satisfactio.
CR
Churn Rate: Percentage of users who stop using an app within a specific time, highlighting retention challenges.
ASD
Average Session Duration: Average time users spend in an app per session, reflecting engagement and content value.
UAC
User Acquisition Cost (UAC): Average cost to acquire a new app user through marketing and advertising efforts.
LTV
Lifetime Value (LTV): Total revenue a business expects to earn from a user over their entire app usage periodю
CR
Conversion Rate (Install to Purchase): Percentage of users who make a purchase after installing the app, showing monetization success.
ARPU
Revenue per User (ARPU): Average revenue generated from each app user, reflecting profitability per individual.
CR
Crash Rate: Percentage of app sessions ending due to crashes, indicating technical stability and performance issues.
FDOR
Funnel Drop-Off Rate: Percentage of users exiting at specific stages of the conversion funnel, identifying friction point.
PNER
Push Notification Engagement Rate: Percentage of users interacting with push notifications, measuring communication effectiveness.
IR
Install Rate: Percentage of users who download an app after viewing its listing, indicating app store appeal.
UR
Uninstall Rate: Percentage of users who uninstall an app after downloading, reflecting dissatisfaction or lack of value.
IAPR
In-App Purchase Revenue: Total income generated from purchases made within the app, contributing to overall app profitability.
93 Charts
Launch Best-in-Class Mobile Apps B2C Company Business Intelligence in Just 48 Hours
DAU Over Time
Line chart tracking daily active users across time, revealing trends in short-term app engagement.
MAU Over Time
Line chart showing monthly active users over time, highlighting growth or decline in long-term audience engagement.
Retention Rate by Cohort
Bar chart comparing user retention rates by cohort, revealing engagement and loyalty patterns over time.
Session Duration Distribution
Histogram showing how long users spend in the app, identifying usage patterns and engagement quality.
UAC by Channel
Bar chart comparing user acquisition costs across advertising sources, highlighting the most cost-effective channels.
Conversion Rate by Channel
Bar chart comparing the percentage of users converting to paying customers by acquisition source, showcasing channel effectiveness.
ARPU Over Time
Line chart tracking average revenue per user monthly, highlighting profitability trends over time.
Churn Rate Over Time
Line chart displaying user churn percentages across time, indicating retention challenges or improvements.
DAU Over Time
Cost per Contact Over Time
Displays cost trends for each customer interaction to manage budgets and efficiency.
Queue Time Distribution
Analyzes call wait times, revealing patterns that impact customer experience.
CES by Month
Shows monthly customer effort scores, emphasizing ease of resolution trends.
Repeat Call Rate by Channel
Compares repeat interaction rates across channels, highlighting areas needing process improvement.
Revenue per Job Over Time
Line chart tracking average income per job weekly, revealing profitability trends.
We talk to industry leaders to uncover best practices
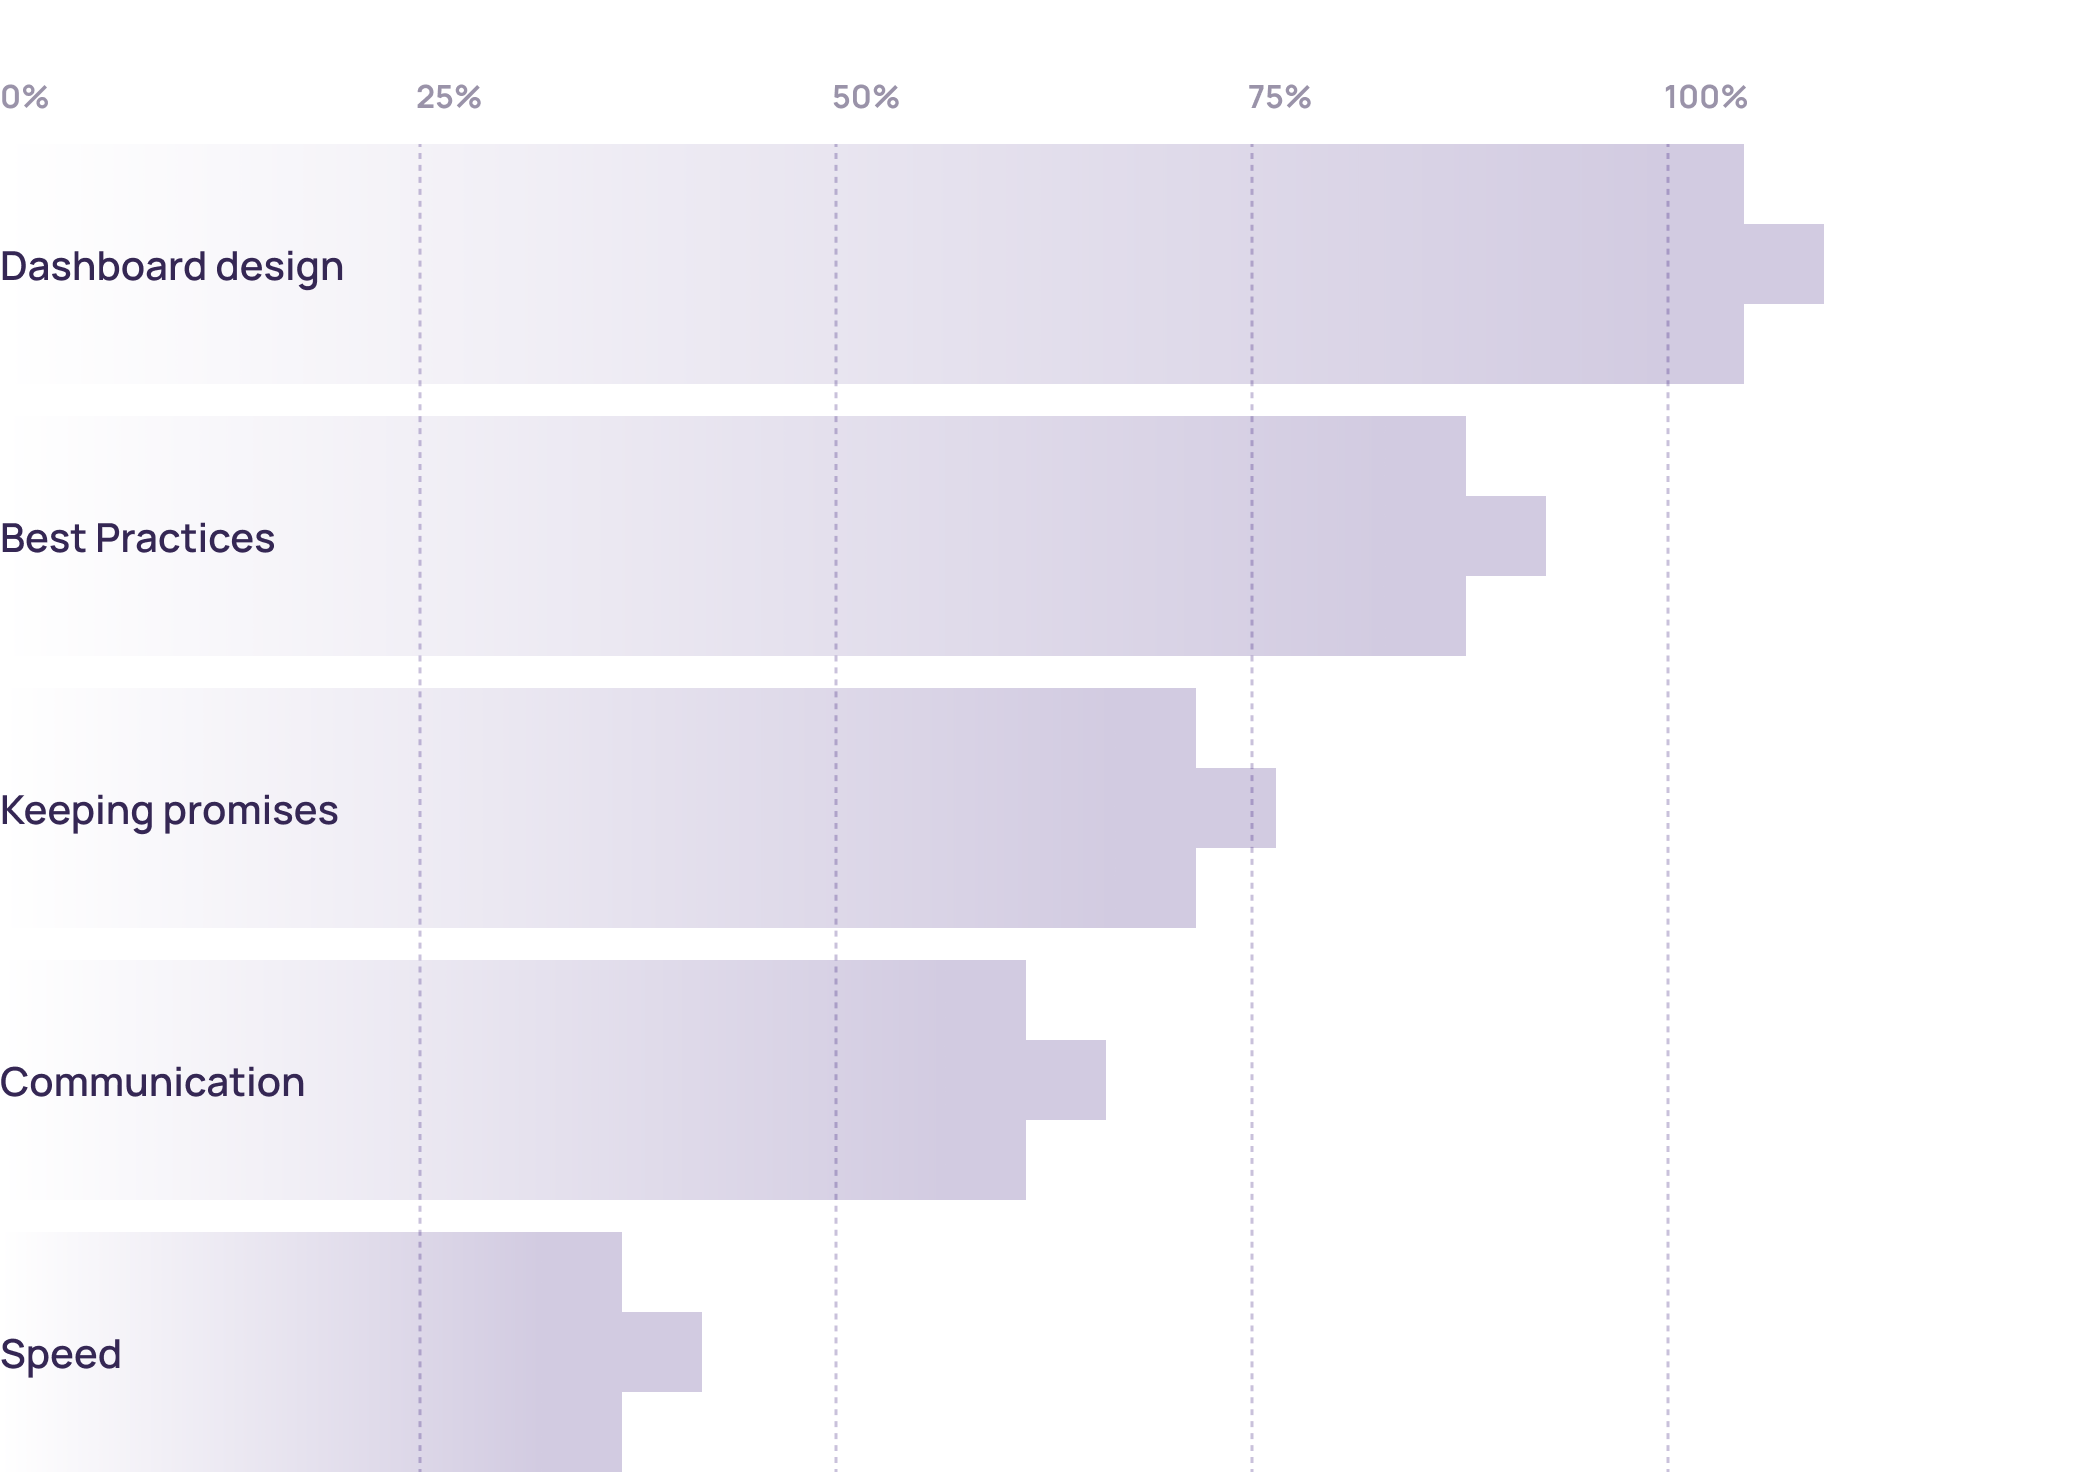
Why customers love us (>100 reviews)
We’ve identified the top five reasons why our clients choose to work with us and continue partnering with us for years.
Our Team
18.
Industry Experts
Our team includes experts with deep knowledge of Mobile Apps B2C industry. These professionals bring years of experience in Mobile Apps B2C, ensuring that we understand your unique challenges and opportunities. Their expertise enables us to deliver tailored BI solutions that address your specific needs and drive meaningful business outcomes.
28.
Visualization Tools
We utilize a wide range of visualization tools to present your data effectively. Our toolkit includes industry-leading software such as Tableau, Power BI, and D3.js, allowing us to create interactive and engaging visualizations. These tools help you explore your data in depth, uncover insights, and communicate findings clearly to stakeholders, facilitating better decision-making across your organization.
50.
Data Engineering Tools
Our engineers use the best tools available to manage and analyze your data. We leverage technologies such as Apache Hadoop, Spark, and SQL databases to handle large volumes of data efficiently. Our data engineering capabilities ensure that your data is cleaned, transformed, and ready for analysis, enabling you to gain accurate and actionable insights from your BI initiatives.
5.
Languages
We offer services in English, Spanish, French, German, and Russian. Our multilingual team ensures that language barriers do not impede your access to top-quality BI solutions. By providing support and documentation in multiple languages, we cater to a diverse client base and ensure effective communication throughout the project lifecycle. This multilingual approach helps us deliver personalized and accessible services to clients worldwide.
24.
Time Zones
Our team operates globally, from Australia to the West Coast, ensuring continuous support. With experts located in multiple time zones, we can provide timely assistance and address your needs around the clock. This global presence ensures that you receive prompt responses to your inquiries, quick resolution of issues, and uninterrupted progress on your BI projects, regardless of your location.
Our Services
Mobile Apps B2C Business Inteligence Outsourcing
Outsource your business intelligence needs to us and focus on your core business activities. Our BI outsourcing services provide you with expert support in managing, analyzing, and interpreting your data. We handle everything from data integration and dashboard creation to advanced analytics and reporting, ensuring that you can leverage data insights without the need for in-house expertise. This allows you to concentrate on strategic initiatives while we manage your BI functions efficiently.
Project Length Starting from 1 Week
Flexible project durations to fit your needs. Whether you require a quick, focused engagement or a long-term partnership, we can tailor our services to match your timeline. Our agile approach allows us to deliver high-quality BI solutions within short timeframes, ensuring that you can address pressing business challenges and capitalize on opportunities promptly.
Educational Programs on Decision-Making
Improve your decision-making skills with our specialized educational programs. Our programs are designed to equip you and your team with the knowledge and tools needed to make data-driven decisions confidently. Through workshops, training sessions, and seminars, we cover topics such as data analysis techniques, interpreting BI reports, and applying insights to business strategies. These educational initiatives help you build a data-centric culture within your organization, empowering you to make better decisions and drive success.