Launch Best-in-Class Healthcare Providers Business Intelligence in Just 48 Hours
28
Data Sources
83
Metrics / KPIs
64
Charts
1
AI decision making assistants
Launch Best-in-Class Healthcare Providers Business Intelligence in Just 48 Hours
28
Data Sources
83
Metrics / KPIs
64
Charts
1
AI decision making assistants
Are we experiencing a rise or fall in customer attrition?
What is the projected revenue from a customer?
Which acquisition channels are the most cost-efficient?
How is our recurring revenue evolving each month?
What trends are visible in our annual recurring revenue?
How is our recurring revenue evolving each month?


Virtual Show Room
If you want to see how leading healthcare providers use data to improve patient outcomes and streamline operations, join our showroom session. We’ll walk you through the systems they rely on — like EHR platforms, patient portals, and analytics tools such as Power BI and Tableau — and show how they bring together clinical, operational, and financial data. Together, we’ll explore key metrics like patient wait times, appointment no-show rates, readmission rates, and care quality scores, and review real dashboards used for performance tracking and compliance monitoring. By the end of the session, we’ll outline a custom decision-making system tailored to your facility’s goals.
Best Practice Data Stack
At Data Never Lies, we understand that for healthcare providers, data is critical to delivering high-quality, efficient care. That’s why we build scalable data solutions using tools like Epic, Cerner, Redox, and Power BI — customized to support clinical workflows, patient experience, and compliance needs. From tracking key metrics like patient throughput, readmission rates, and provider utilization to integrating EHR data with operational systems, we create analytics stacks that drive better outcomes and decision-making. With our expertise, your data becomes more than just organized — it becomes a trusted source of insight for improving care and optimizing performance.
23 Data Sources
Launch Best-in-Class Healthcare Providers Company Business Intelligence in Just 48 Hours

Athenahealth
A cloud-based healthcare software offering electronic health records (EHR), revenue cycle management, and patient engagement tools.

Cerner
A healthcare technology platform offering EHR, population health management, and revenue cycle solutions.

Kareo
A medical practice management software focused on EHR, billing, and telehealth for independent healthcare providers.

Allscripts
A healthcare IT platform providing EHR, practice management, and population health solutions.

Epicor
A flexible ERP system tailored for manufacturing and distribution industries to streamline operations and drive growth.

eClinicalWorks
A comprehensive cloud-based EHR and practice management solution for healthcare providers of all sizes.

NextGen
A healthcare IT platform offering EHR, practice management, and patient engagement solutions for ambulatory practices.

Greenway Health
A healthcare technology company providing integrated EHR and practice management solutions for small to mid-sized practices.

DrChrono
A cloud-based EHR and practice management platform offering telehealth, billing, and customizable solutions.

Practice Fusion
A cloud-based EHR system designed for small practices, focusing on affordability and ease of use.

Sage Intacct
A cloud financial management solution offering accounting, billing, and reporting tools for growing businesses.

FreshBooks
A user-friendly cloud-based accounting software focused on invoicing, expense tracking, and financial reporting for freelancers and small businesses.

Xero
A cloud-based accounting platform providing tools for bookkeeping, invoicing, and financial tracking for businesses.
83 Metrics
Launch Best-in-Class Healthcare Providers Company Business Intelligence in Just 48 Hours
ANSR
Appointment No-Show Rate: Percentage of scheduled appointments missed by patients without prior cancellation, impacting provider efficiency.
ARPV
Average Revenue per Visit: The average income generated from each patient visit, useful for assessing financial performance.
CSAT
Patient Satisfaction Score (CSAT): A measure of patients’ contentment with their care, gathered through post-visit surveys or feedback.
WTPP
Wait Time per Patient: The average time patients spend waiting before receiving care, affecting overall satisfaction.
PUR
Provider Utilization Rate: The percentage of a healthcare provider’s available time actively spent delivering patient care.
CDR
Claim Denial Rate: The percentage of insurance claims rejected by payers, indicating potential billing or documentation issues.
RCE
Revenue Cycle Efficiency: A measure of how effectively a healthcare organization manages billing, payments, and collections.
TU
Telehealth Utilization: The proportion of patient appointments conducted remotely via telehealth platforms, reflecting digital healthcare adoption.
PRR
Patient Retention Rate: The percentage of patients who return for continued care, showcasing loyalty and satisfaction.
PAC
Patient Acquisition Cost (PAC): The cost incurred to attract and onboard each new patient, influencing marketing and operational budgets.
OCPV
Operational Cost per Visit: The average expense of delivering care per patient visit, helping assess cost efficiency.
PD
Patient Demographics: Statistical data on patient characteristics, such as age, gender, and location, informing care strategies.
MA
Medication Adherence: The extent to which patients follow prescribed medication plans, crucial for treatment success.
RR
Referral Rate: The percentage of patients referred to specialists or other services, reflecting care coordination and satisfaction.
64 Charts
Launch Best-in-Class Healthcare Providers Company Business Intelligence in Just 48 Hours
Utilization Rate by Provider
Compares provider utilization rates to identify disparities in workload and efficiency.
Claim Denials Over Time
Tracks the trend of insurance claim denials, helping pinpoint billing or documentation issues.
Days in A/R Over Time
Monitors the time taken to collect payments over time, assessing revenue cycle efficiency.
Telehealth Sessions Over Time
Tracks the volume of telehealth appointments over time, showing digital healthcare adoption trends.
Retention Rate by Month
Displays patient retention trends, helping gauge satisfaction and loyalty on a monthly basis.
Website Visits
Website Visits (Line Chart by Day/Month)
Track website traffic trends over time to assess audience engagement and the effectiveness of marketing campaigns.
Employee Satisfaction Over Time
Employee Satisfaction Over Time (Line Chart by Quarter)
Monitor employee satisfaction scores quarterly to evaluate workplace morale and inform HR strategies.
Revenue Growth Percentage
Revenue Growth Percentage (Line Chart Over Time)
Track revenue growth percentage trends over time to measure financial performance and identify growth opportunities.
MRR Expansion Over Time
MRR Expansion Over Time (Stacked Bar Chart)
Visualize monthly recurring revenue (MRR) growth driven by expansions with a stacked bar chart for clear insights.
Net Churn Over Time
Net Churn Over Time (Line Chart by Month)
Analyze net churn trends monthly by factoring in both customer losses and expansions to evaluate growth sustainability.
Gross Churn Over Time
Gross Churn Over Time (Line Chart by Month)
Track gross churn trends over time to understand customer loss and its impact on revenue.
PAC by Channel
Compares patient acquisition costs across different marketing channels to optimize spending.
Cost per Visit Over Time
Shows trends in operational costs per visit, aiding in efficiency and budget management.
Patient Demographics Breakdown
Visualizes the distribution of patient characteristics like age or gender, informing care strategies.
Adherence Rate Over Time
Tracks changes in medication adherence rates, highlighting trends and treatment success over time.
Referrals Over Time
Displays the number of patient referrals over time, showing care coordination and outreach effectiveness.
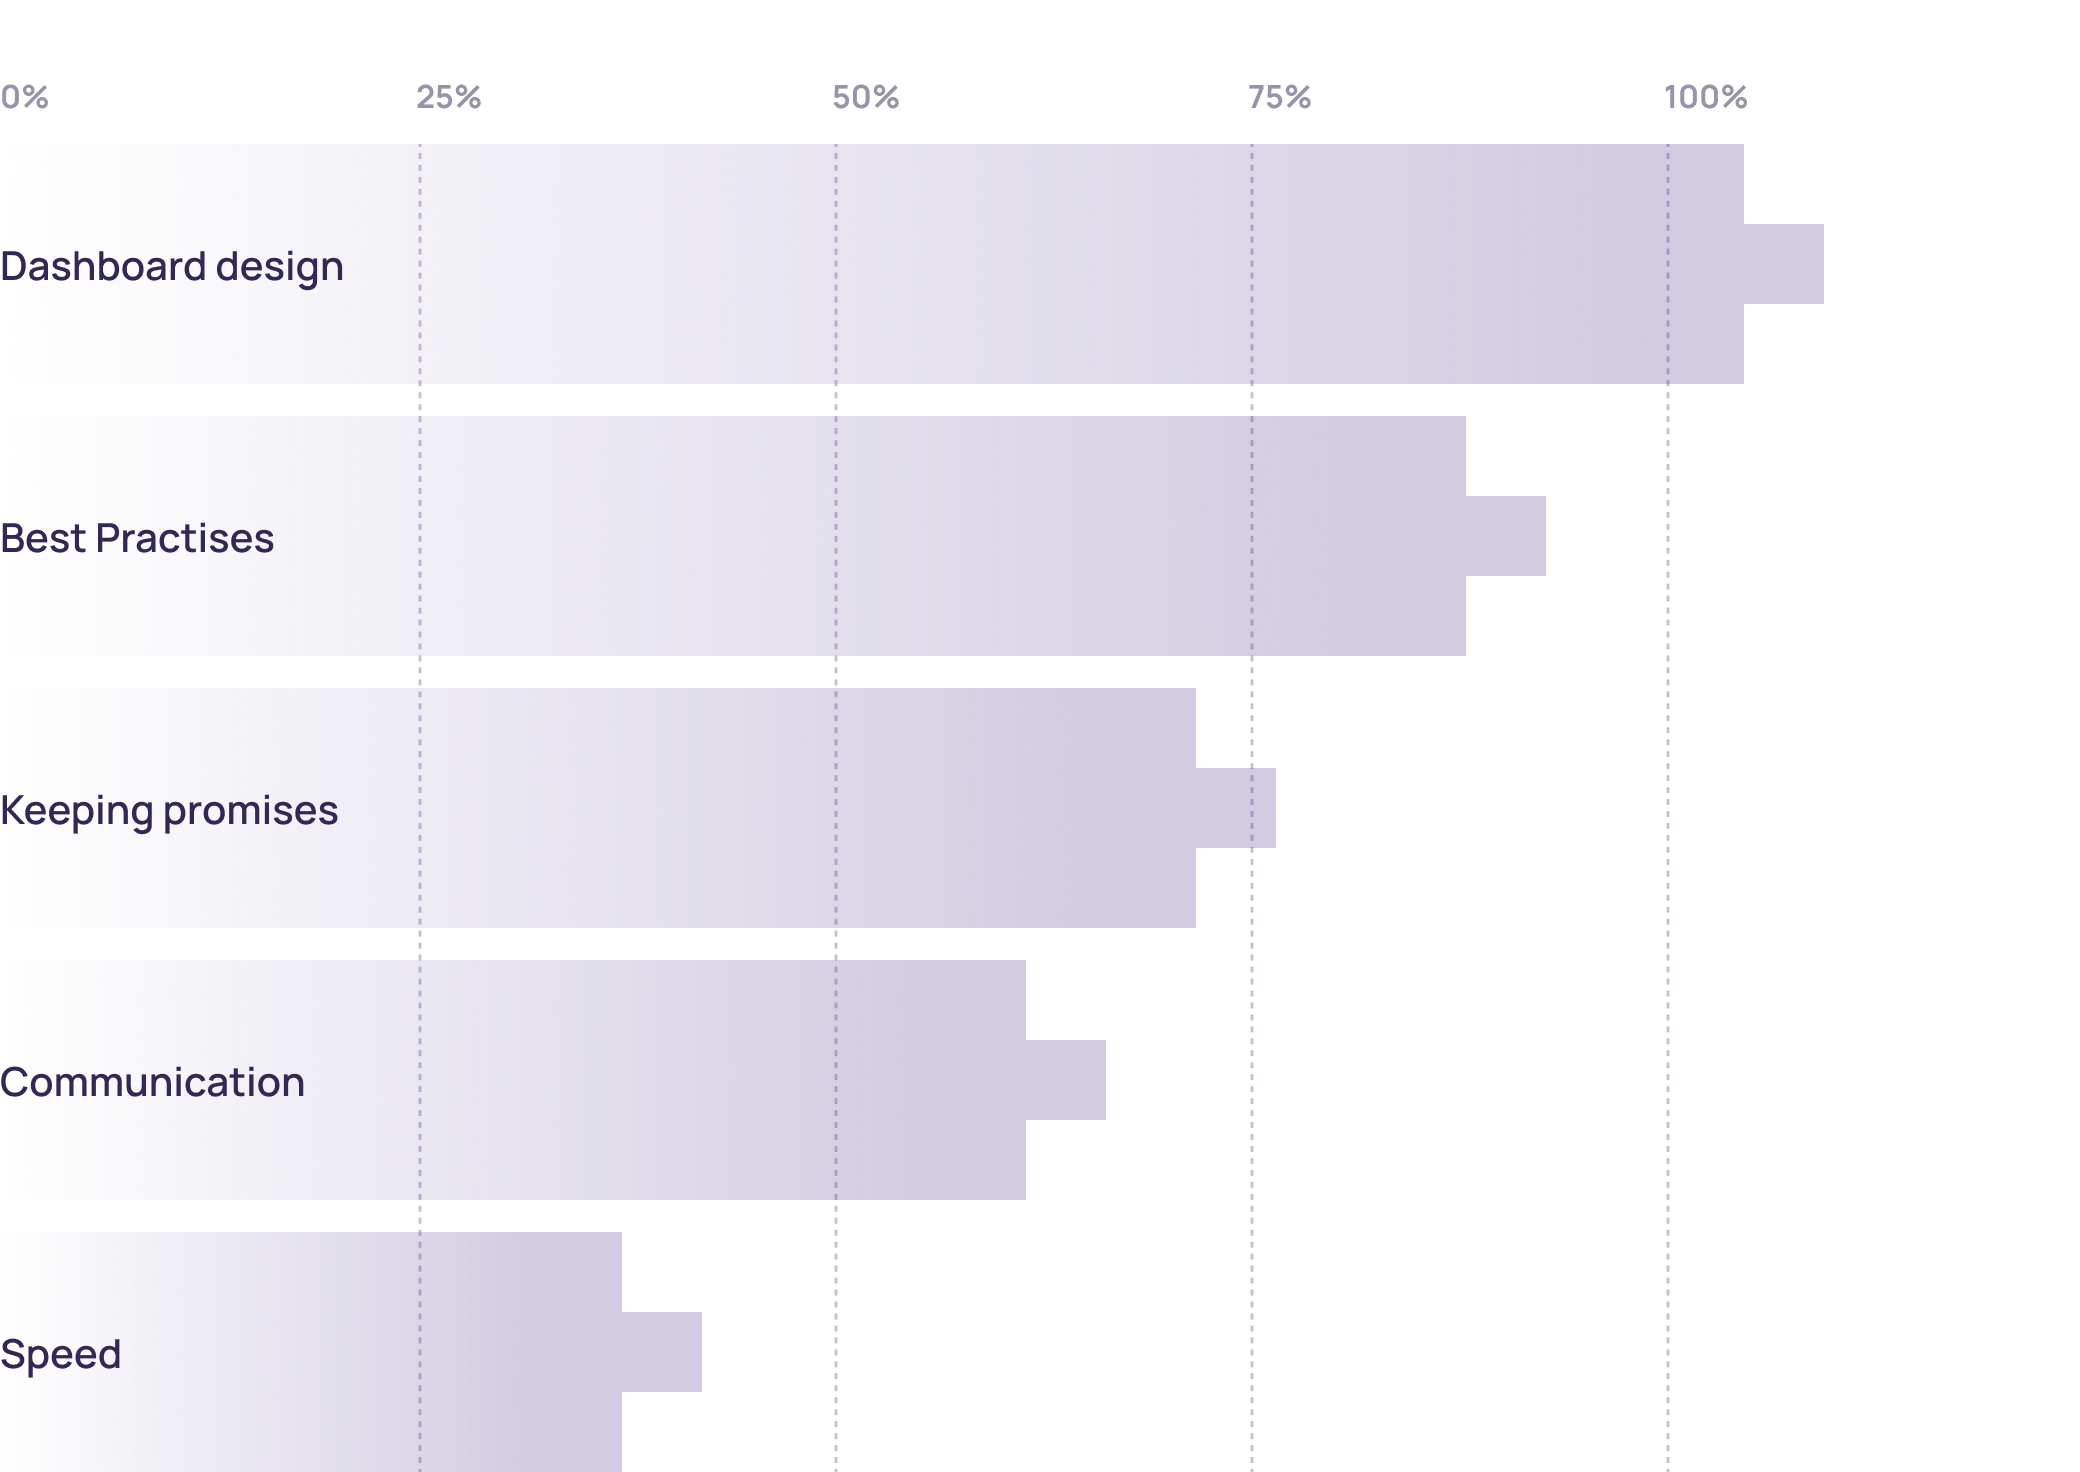
Why customers love us (>100 review)
We’ve identified the top five reasons why our clients choose to work with us and continue partnering with us for years.