Launch Best-in-Class Employee Analytics Business Intelligence in Just 48 Hours
74
Data Sources
52
Metrics / KPIs
44
Charts
2
AI decision making assistants
Launch Best-in-Class Employee Analytics Business Intelligence in Just 48 Hours
74
Data Sources
52
Metrics / KPIs
44
Charts
2
AI decision making assistants
Are we experiencing a rise or fall in customer attrition?
What is the projected revenue from a customer?
Which acquisition channels are the most cost-efficient?
How is our recurring revenue evolving each month?
What trends are visible in our annual recurring revenue?
How is our recurring revenue evolving each month?


Virtual Show Room
If you want to see how leading employee analytics companies leverage data to improve workforce performance and retention, join our showroom session. We’ll walk you through the platforms they rely on — like Workday, SAP SuccessFactors, BambooHR, and Power BI — and show how they integrate data across HR, performance reviews, engagement surveys, and productivity tools. Together, we’ll explore key metrics such as employee retention rate, time-to-hire, engagement scores, DEI indicators, and performance distribution, and review real dashboards used for HR reporting and strategic workforce planning. By the end of the session, we’ll outline a tailored decision-making system aligned with your team’s people analytics goals.
Best Practice Data Stack
At Data Never Lies, we understand that in employee analytics, impactful decisions come from connected, people-focused insights. That’s why we build scalable data solutions using platforms like Workday, BambooHR, SAP SuccessFactors, and Power BI — tailored to unify data across hiring, performance, engagement, and retention. From tracking metrics like turnover rate, time-to-hire, employee engagement scores, DEI benchmarks, and training completion rates, we help HR and people analytics teams turn scattered data into strategic guidance. With our expertise, your workforce data isn’t just organized — it becomes a powerful story that drives culture, performance, and long-term retention.
74 Data Sources
Launch Best-in-Class Employee Analytics Company Business Intelligence in Just 48 Hours

Toggl Track
A simple time tracking tool for monitoring work hours and improving productivity.

Hubstaff
A time tracking and productivity monitoring tool with features for remote team management.

SurveyMonkey
An online survey tool for creating, distributing, and analyzing feedback from customers and employees.

Microsoft Project
A robust project management software for planning, scheduling, and tracking project progress and resources.

Chargebee
Chargebee is a subscription management platform that automates billing, invoicing, and revenue operations for businesses with recurring revenue models.

Amplitude
Amplitude is a product analytics platform that helps businesses understand user behavior, optimize experiences, and drive growth through data insights.

Marketo
Marketo is a marketing automation platform that helps businesses manage campaigns, track leads, and analyze marketing performance.

Workday
Workday is a cloud-based platform for managing human resources, finance, and payroll, offering real-time insights and streamlined workflows.

Zoom
A video conferencing platform for meetings, webinars, and online collaboration with screen sharing and recording features.

Slack
A messaging and collaboration tool for teams, enabling real-time communication, file sharing, and integrations with work apps.

Microsoft Viva
An employee experience platform integrating learning, insights, and well-being within Microsoft 365 for workplace engagement and productivity.
52 Metrics
Launch Best-in-Class Employee Analytics Company Business Intelligence in Just 48 Hours
EPR
Employee Productivity Rate – Measures employee output relative to time worked, indicating efficiency and overall performance.
ES
Engagement Score – A metric assessing employee satisfaction, motivation, and commitment to their work and organization.
AMPW
Average Meetings per Week – Tracks the number of meetings per employee, assessing collaboration levels and potential time management challenges.
SUR
System Usage Rate – Measures how frequently employees use workplace systems or tools, indicating adoption and operational efficiency.
ERT
Email Response Time – The average time taken for employees to respond to emails, reflecting communication efficiency.
EAR
Employee Absenteeism Rate – The percentage of scheduled work time employees miss, impacting productivity and workforce stability.
ICUR
Internal Chat Usage Rate – Tracks how often employees use internal messaging tools, reflecting collaboration and communication habits.
EPR
Event Participation Rate – Measures employee attendance at company events, reflecting engagement and workplace culture involvement.
ETR
Employee Turnover Rate – The percentage of employees leaving the company within a given period, indicating retention challenges.
PRF
Peer Recognition Frequency – Tracks how often employees acknowledge colleagues’ contributions, fostering a positive workplace culture.
EOR
Email Open Rate – The percentage of internal emails opened by employees, measuring communication effectiveness.
TST
Time Spent on Training – Tracks the average time employees dedicate to learning programs, indicating development investment.
NPS
Net Promoter Score (NPS) – Measures employee satisfaction and likelihood of recommending the company to others.
TCR
Task Completion Rate – The percentage of assigned tasks completed within a timeframe, indicating productivity and workflow efficiency.
CR
Collaboration Rate – Measures how often employees work together on projects, reflecting teamwork and organizational synergy.
44 Charts
Launch Best-in-Class Employee Analytics Company Business Intelligence in Just 48 Hours
Productivity Rate by Department
Compares productivity levels across departments, highlighting efficiency and identifying areas for improvement.
Engagement Score by Team
Visualizes team engagement levels, revealing satisfaction and motivation differences across groups.
Response Time by Employee
Displays individual email response times, identifying communication efficiency and potential bottlenecks.
Meetings by Week
Tracks the number of meetings weekly, indicating collaboration trends and potential time management issues.
System Usage by Tool
Illustrates usage distribution across tools, highlighting adoption rates and resource preferences.
Absenteeism by Month
Shows monthly absenteeism trends, helping to identify patterns and address attendance issues.
Participation Rate by Event Type
Compares attendance across event types, revealing employee interest and engagement patterns.
Turnover Rate by Department
Highlights employee turnover in each department, identifying retention challenges and stability concerns.
Recognition Events by Employee
Displays the frequency of peer recognition, fostering a culture of appreciation and support.
Open Rate by Team
Compares email open rates across teams, assessing communication reach and effectiveness.
Training Hours by Employee
Tracks individual training hours, indicating commitment to professional development and skill enhancement.
NPS Over Time
Illustrates changes in employee satisfaction and loyalty, reflecting organizational culture and morale trends.
Task Completion by Employee
Shows task completion rates for each employee, highlighting productivity and performance variations.
Collaboration Events by Team
Compares teamwork instances across teams, reflecting cooperation levels and collaborative culture.
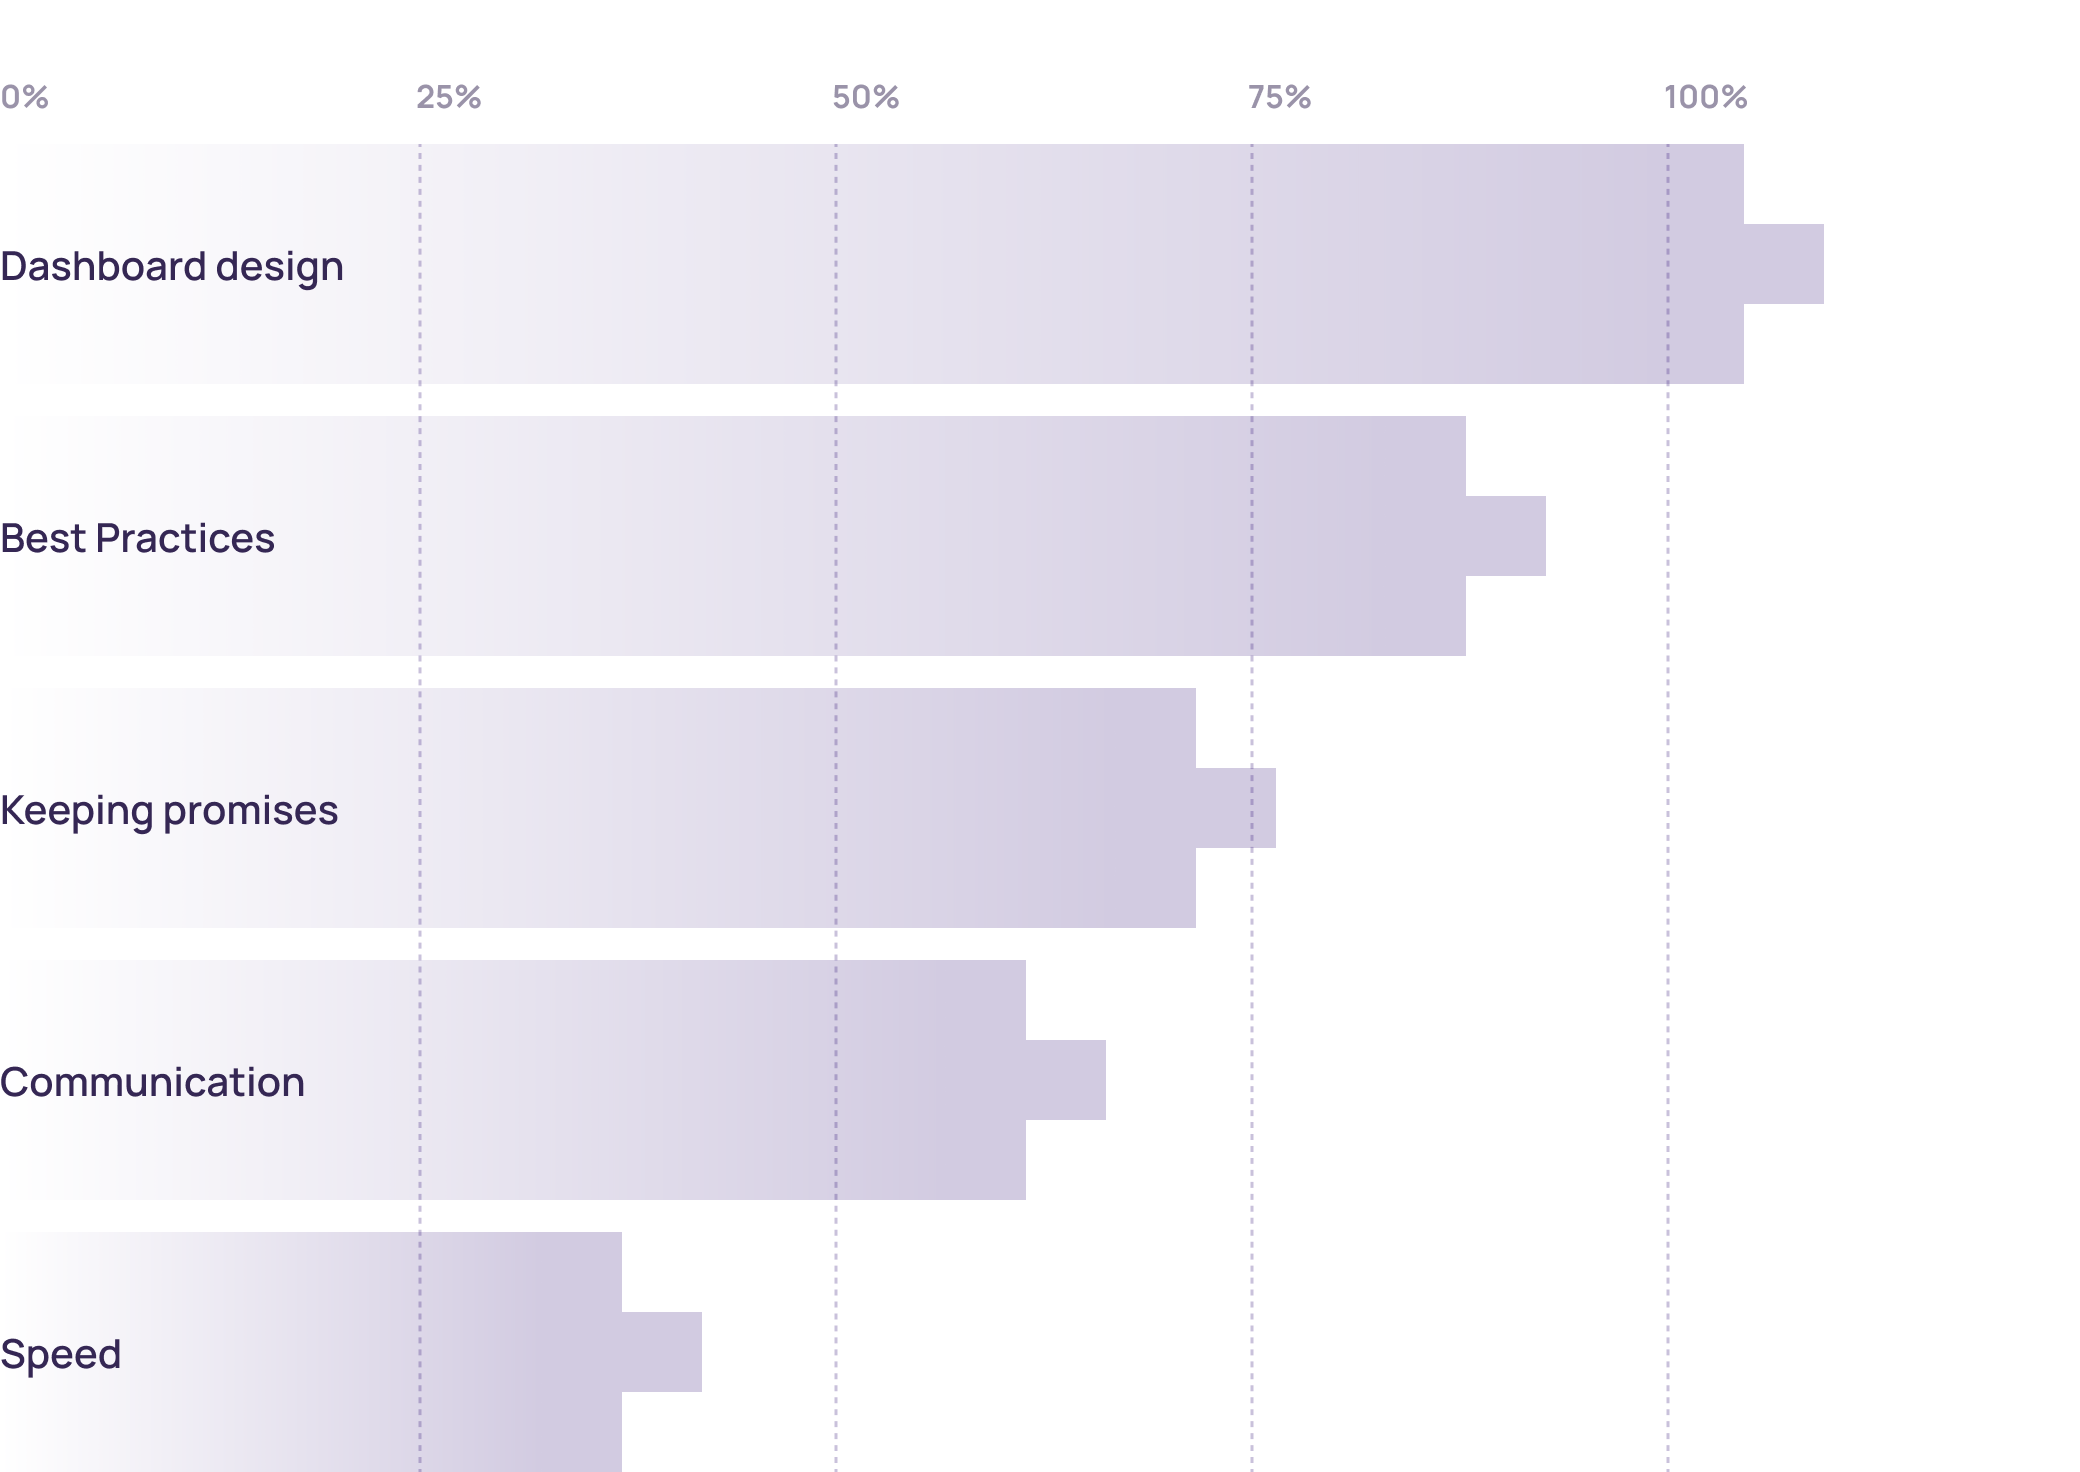
Why customers love us (>100 reviews)
We’ve identified the top five reasons why our clients choose to work with us and continue partnering with us for years.
Our Team
18.
Industry Experts
Our team includes experts with deep knowledge of Employee Analytics industry. These professionals bring years of experience in Employee Analytics, ensuring that we understand your unique challenges and opportunities. Their expertise enables us to deliver tailored BI solutions that address your specific needs and drive meaningful business outcomes.
28.
Visualization Tools
We utilize a wide range of visualization tools to present your data effectively. Our toolkit includes industry-leading software such as Tableau, Power BI, and D3.js, allowing us to create interactive and engaging visualizations. These tools help you explore your data in depth, uncover insights, and communicate findings clearly to stakeholders, facilitating better decision-making across your organization.
50.
Data Engineering Tools
Our engineers use the best tools available to manage and analyze your data. We leverage technologies such as Apache Hadoop, Spark, and SQL databases to handle large volumes of data efficiently. Our data engineering capabilities ensure that your data is cleaned, transformed, and ready for analysis, enabling you to gain accurate and actionable insights from your BI initiatives.
5.
Languages
We offer services in English, Spanish, French, German, and Russian. Our multilingual team ensures that language barriers do not impede your access to top-quality BI solutions. By providing support and documentation in multiple languages, we cater to a diverse client base and ensure effective communication throughout the project lifecycle. This multilingual approach helps us deliver personalized and accessible services to clients worldwide.
24.
Time Zones
Our team operates globally, from Australia to the West Coast, ensuring continuous support. With experts located in multiple time zones, we can provide timely assistance and address your needs around the clock. This global presence ensures that you receive prompt responses to your inquiries, quick resolution of issues, and uninterrupted progress on your BI projects, regardless of your location.
Our Services
Employee Analytics Business Inteligence Outsourcing
Outsource your business intelligence needs to us and focus on your core business activities. Our BI outsourcing services provide you with expert support in managing, analyzing, and interpreting your data. We handle everything from data integration and dashboard creation to advanced analytics and reporting, ensuring that you can leverage data insights without the need for in-house expertise. This allows you to concentrate on strategic initiatives while we manage your BI functions efficiently.
Project Length Starting from 1 Week
Flexible project durations to fit your needs. Whether you require a quick, focused engagement or a long-term partnership, we can tailor our services to match your timeline. Our agile approach allows us to deliver high-quality BI solutions within short timeframes, ensuring that you can address pressing business challenges and capitalize on opportunities promptly.
Educational Programs on Decision-Making
Improve your decision-making skills with our specialized educational programs. Our programs are designed to equip you and your team with the knowledge and tools needed to make data-driven decisions confidently. Through workshops, training sessions, and seminars, we cover topics such as data analysis techniques, interpreting BI reports, and applying insights to business strategies. These educational initiatives help you build a data-centric culture within your organization, empowering you to make better decisions and drive success.