Launch Best-in-Class Consulting Companies Business Intelligence in Just 48 Hours
37
Data Sources
47
Metrics / KPIs
33
Charts
3
AI decision making assistants
Launch Best-in-Class Consulting Companies Business Intelligence in Just 48 Hours
37
Data Sources
47
Metrics / KPIs
33
Charts
3
AI decision making assistants
Which projects have the highest number of overdue tasks?
How much revenue is generated by each project over time?
What percentage of logged hours are billable versus non-billable?


Virtual Show Room
If you want to learn how the top Consulting Companies companies make decisions globally, sign up for our showroom session. We’ll walk you through the data sources they rely on, the technical solutions and tools in use. Together, we’ll explore the key metrics used for calculations and decision-making, and review examples of company dashboards. By the end of the session, we’ll be able to create a prototype decision-making system tailored to your needs.
Best Practice Data Stack
At Data Never Lies, we believe every data story begins with a solid foundation. That’s why we work with best-in-class tools and platforms tailored to your unique needs. From advanced analytics and visualization to seamless integrations, we design scalable data stacks that empower your team to uncover insights and take confident action. With our expertise, your data isn’t just organized—it’s optimized for storytelling that inspires.
37 Data Sources
Launch Best-in-Class Consulting Companies Company Business Intelligence in Just 48 Hours
Asana
A collaborative project management tool for tracking tasks, deadlines, and workflows, ideal for teams of all sizes.

Monday.com
A flexible work operating system for managing projects, tasks, and team collaboration with customizable workflows.

Smartsheet
A spreadsheet-based project management tool for task tracking, resource allocation, and collaboration.

Wrike
A work management platform with features for task tracking, collaboration, and advanced reporting for project visibility.
Mavenlink
A professional services automation tool combining project management, resource planning, and financial tracking.

ClickUp
An all-in-one productivity platform for project management, task tracking, and team collaboration.
Teamwork
A project management tool designed for client work, offering task tracking, time logging, and resource planning.
Microsoft Project
A robust project management software for planning, scheduling, and tracking project progress and resources.

Zoho Projects
A cloud-based project management tool with features for task tracking, Gantt charts, and team collaboration.

Jira
A project management and issue-tracking tool, widely used for software development and agile workflows.
Harvest
A time tracking and invoicing tool for managing billable hours and project budgets.
Toggl Track
A simple time tracking tool for monitoring work hours and improving productivity.
TimeCamp
A time tracking tool with automatic timesheet generation and project profitability insights.

Hubstaff
A time tracking and productivity monitoring tool with features for remote team management.
ClickUp
47 Metrics
Launch Best-in-Class Consulting Companies Company Business Intelligence in Just 48 Hours
PP
Project Profitability: The financial gain from a project after deducting all associated costs, indicating overall project success.
BHP
Billable Hours Percentage: The proportion of total hours worked that are billed to clients, reflecting revenue-generating efficiency.
RUR
Resource Utilization Rate: Percentage of available work hours spent on productive, billable tasks, measuring workforce efficiency.
CPP
Cost per Project: Total expenses incurred to complete a project, helping evaluate cost management and profitability.
RPP
Revenue per Project: Total income generated from a project, reflecting its financial contribution to the business.
HLPP
Hours Logged per Project: Total hours recorded for a project, providing insights into effort and resource allocation.
PM
Project Margins: The percentage difference between project revenue and costs, showing profitability.
CUBL
Consultant Utilization by Level: Percentage of billable hours worked by consultants at various experience levels, highlighting resource efficiency.
CRR
Client Retention Rate: Percentage of clients continuing to engage with the business after project completion, reflecting satisfaction and loyalty.
APD
Average Project Duration: The average time taken to complete projects, offering insights into operational efficiency.
AHR
Average Hourly Rate: Revenue earned per hour of work, calculated by dividing total project revenue by hours worked.
NBHP
Non-Billable Hours Percentage: Proportion of hours spent on tasks not billed to clients, indicating time spent on administrative or internal work.
CTR
Consultant Turnover Rate: Percentage of consultants leaving within a specific period, reflecting workforce stability and satisfaction.
RFA
Revenue Forecast Accuracy: Degree to which predicted project revenue aligns with actual outcomes, indicating reliability of forecasting methods.
PB
Project Backlog: The total number of pending projects waiting to be started, highlighting workload and resource planning needs.
33 Charts
Launch Best-in-Class Consulting Companies Company Business Intelligence in Just 48 Hours
Profitability by Project
Bar chart showing profit margins for each project, highlighting financial performance and successful ventures.
Billable Hours by Consultant Level
Bar chart comparing billable hours across consultant levels, reflecting workload distribution and efficiency.
Utilization Rate by Consultant
Bar chart displaying each consultant’s productive work percentage, measuring individual contribution and efficiency.
Cost Breakdown by Project
Pie chart illustrating expense categories for each project, providing a clear view of cost allocation.
Revenue per Project Over Time
Line chart tracking revenue trends for projects, highlighting financial performance improvements or declines.
Hours Logged by Week
Line chart showing weekly work hours per project, monitoring resource allocation and effort trends.
Margins by Project
Bar chart comparing profit margins for individual projects, reflecting cost management and profitability.
Utilization by Consultant Level
Stacked bar chart comparing productive work percentages for consultants at various experience levels.
Retention Rate by Client
Bar chart illustrating the percentage of repeat engagements by clients, showing loyalty and satisfaction trends.
Project Duration Over Time
Line chart showing how average project timelines evolve, identifying efficiency improvements or delays.
Average Rate by Consultant Level
Bar chart comparing hourly revenue rates for consultants across experience levels, reflecting billing efficiency.
Non-Billable Hours Over Time
Line chart tracking administrative or internal work hours, highlighting potential inefficiencies.
Turnover Rate by Consultant Level
Line chart displaying consultant departure rates by level, identifying stability issues at specific roles.
Forecast vs Actual Revenue
Bar chart comparing predicted and actual project revenue, measuring forecasting accuracy.
Backlog by Project
Stacked bar chart showing the workload of pending tasks across projects, aiding in resource planning.
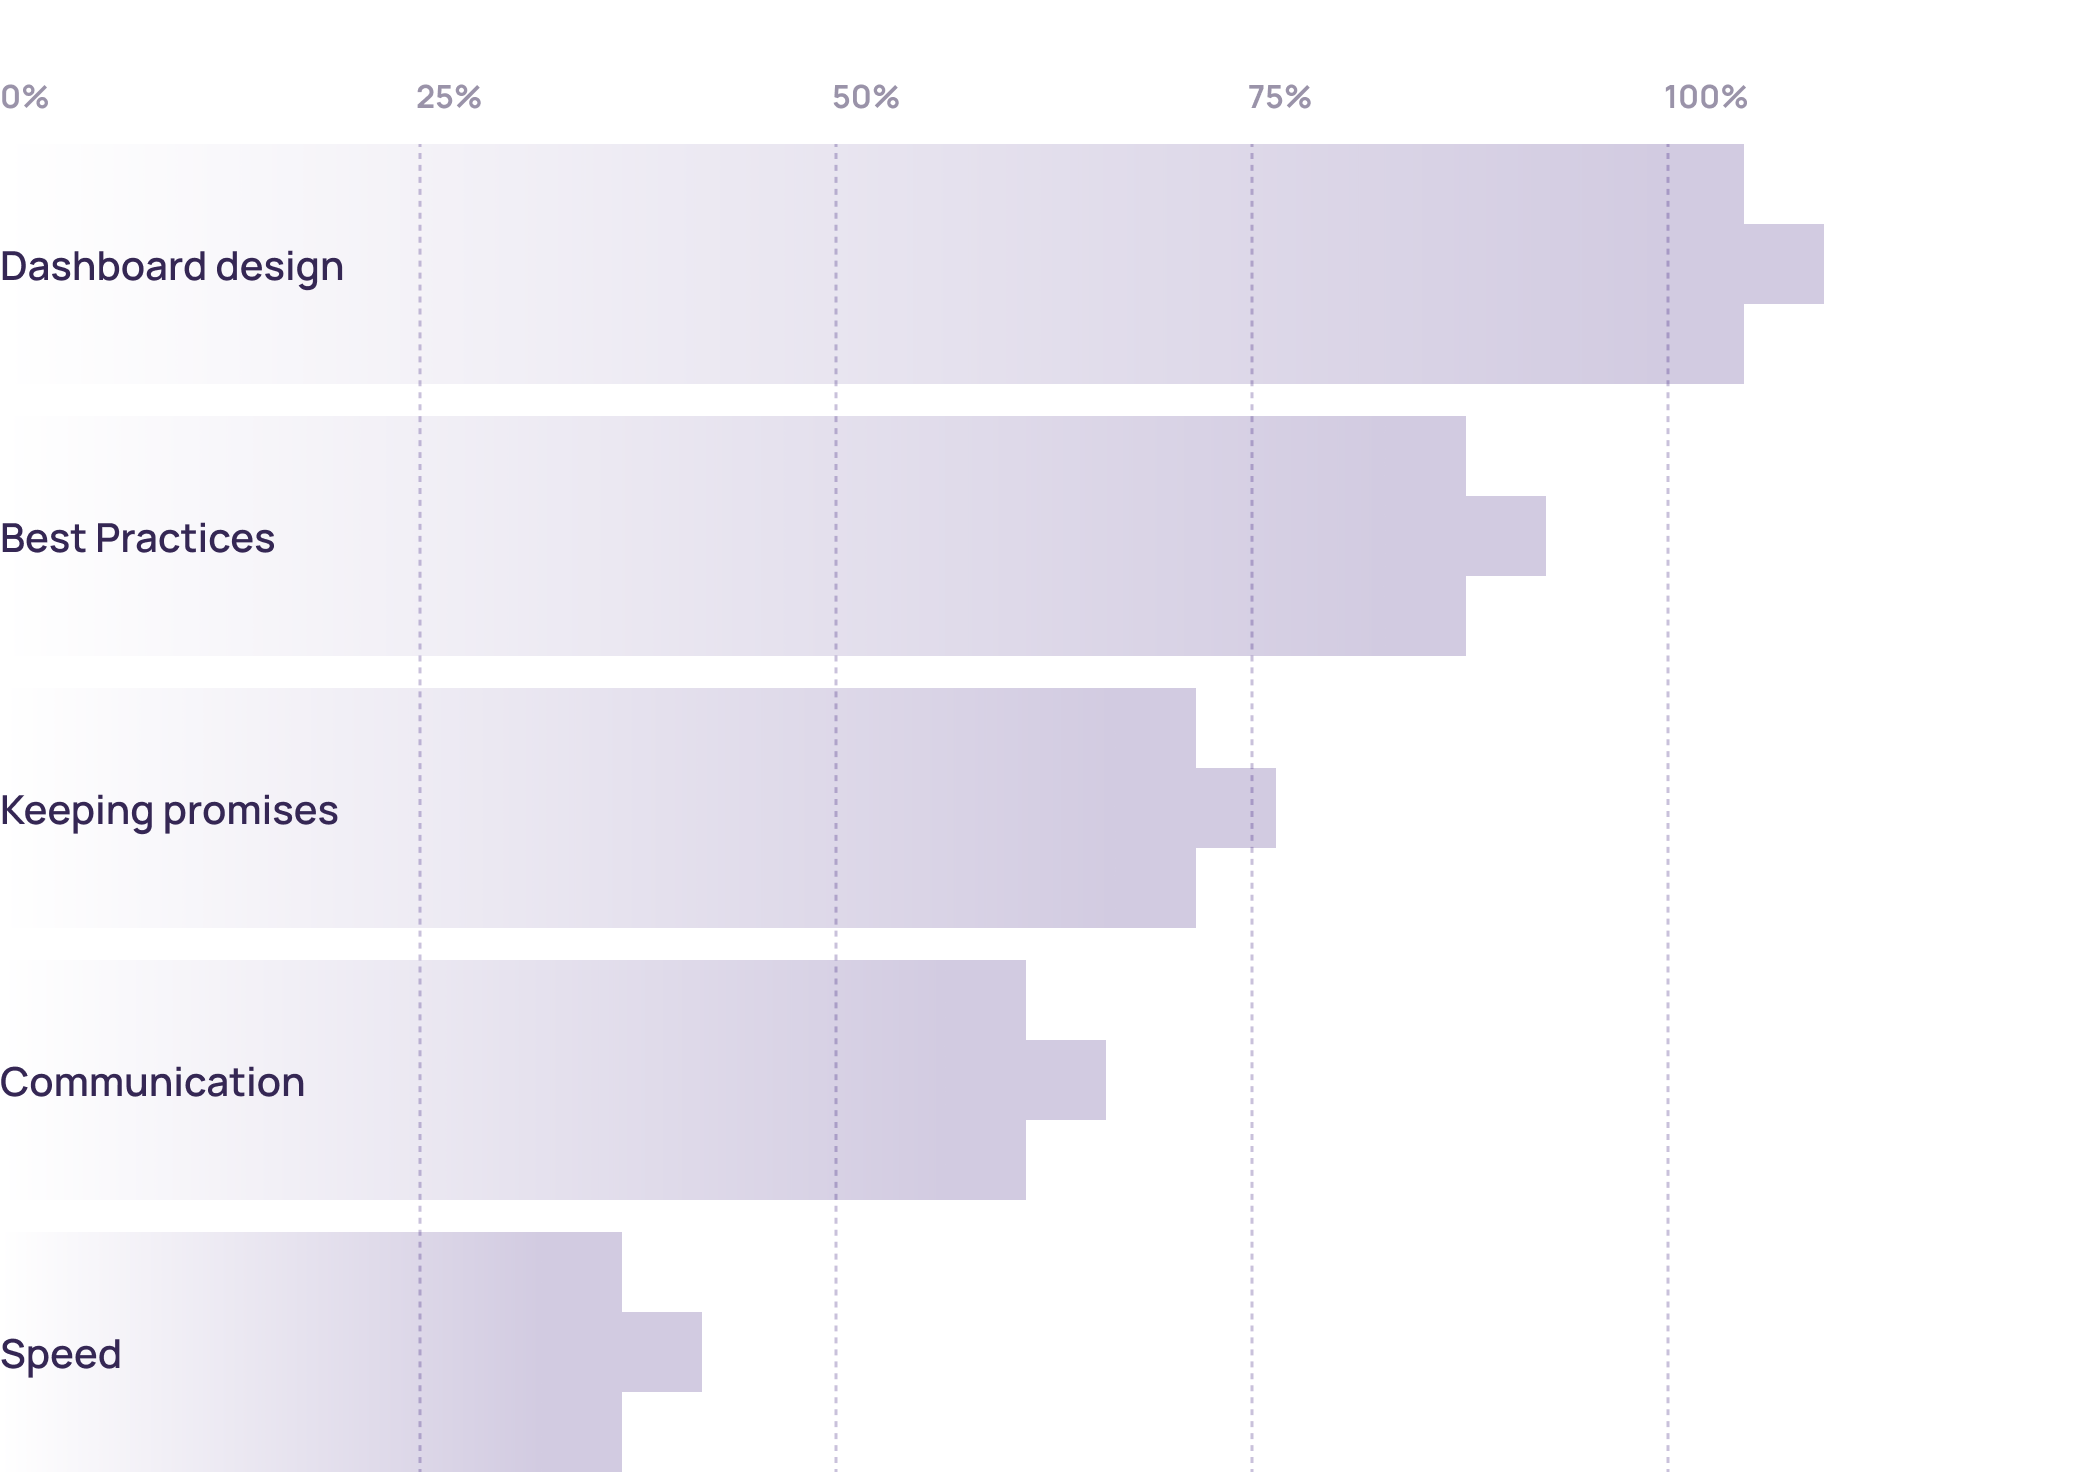
Why customers love us (>100 reviews)
We’ve identified the top five reasons why our clients choose to work with us and continue partnering with us for years.
Our Team
18.
Industry Experts
Our team includes experts with deep knowledge of Consulting Companies industry. These professionals bring years of experience in Consulting Companies, ensuring that we understand your unique challenges and opportunities. Their expertise enables us to deliver tailored BI solutions that address your specific needs and drive meaningful business outcomes.
28.
Visualization Tools
We utilize a wide range of visualization tools to present your data effectively. Our toolkit includes industry-leading software such as Tableau, Power BI, and D3.js, allowing us to create interactive and engaging visualizations. These tools help you explore your data in depth, uncover insights, and communicate findings clearly to stakeholders, facilitating better decision-making across your organization.
50.
Data Engineering Tools
Our engineers use the best tools available to manage and analyze your data. We leverage technologies such as Apache Hadoop, Spark, and SQL databases to handle large volumes of data efficiently. Our data engineering capabilities ensure that your data is cleaned, transformed, and ready for analysis, enabling you to gain accurate and actionable insights from your BI initiatives.
5.
Languages
We offer services in English, Spanish, French, German, and Russian. Our multilingual team ensures that language barriers do not impede your access to top-quality BI solutions. By providing support and documentation in multiple languages, we cater to a diverse client base and ensure effective communication throughout the project lifecycle. This multilingual approach helps us deliver personalized and accessible services to clients worldwide.
24.
Time Zones
Our team operates globally, from Australia to the West Coast, ensuring continuous support. With experts located in multiple time zones, we can provide timely assistance and address your needs around the clock. This global presence ensures that you receive prompt responses to your inquiries, quick resolution of issues, and uninterrupted progress on your BI projects, regardless of your location.
Our Services
Consulting Companies Business Inteligence Outsourcing
Outsource your business intelligence needs to us and focus on your core business activities. Our BI outsourcing services provide you with expert support in managing, analyzing, and interpreting your data. We handle everything from data integration and dashboard creation to advanced analytics and reporting, ensuring that you can leverage data insights without the need for in-house expertise. This allows you to concentrate on strategic initiatives while we manage your BI functions efficiently.
Project Length Starting from 1 Week
Flexible project durations to fit your needs. Whether you require a quick, focused engagement or a long-term partnership, we can tailor our services to match your timeline. Our agile approach allows us to deliver high-quality BI solutions within short timeframes, ensuring that you can address pressing business challenges and capitalize on opportunities promptly.
Educational Programs on Decision-Making
Improve your decision-making skills with our specialized educational programs. Our programs are designed to equip you and your team with the knowledge and tools needed to make data-driven decisions confidently. Through workshops, training sessions, and seminars, we cover topics such as data analysis techniques, interpreting BI reports, and applying insights to business strategies. These educational initiatives help you build a data-centric culture within your organization, empowering you to make better decisions and drive success.