Launch Best-in-Class Chief Financial Officer Business Intelligence in Just 48 Hours
29
Data Sources
97
Metrics / KPIs
40
Charts
4
AI decision making assistants
Launch Best-in-Class Chief Financial Officer Business Intelligence in Just 48 Hours
29
Data Sources
97
Metrics / KPIs
40
Charts
4
AI decision making assistants
Which products or services are the most profitable?
What is the distribution of expenses across different categories?
How does actual spending compare to the budgeted amounts?


Virtual Show Room
If you want to see how top CFOs make data-driven financial decisions across global operations, join our showroom session. We’ll walk you through the financial systems they trust — like NetSuite, SAP, Power BI, and Excel modeling — and show how they integrate data across FP&A, accounting, operations, and strategy. Together, we’ll explore core metrics such as EBITDA, cash flow forecasts, working capital, burn rate, and budget variance, and review real dashboards used for board reporting, investor updates, and strategic planning. By the end of the session, we’ll outline a custom decision-making framework tailored to your organization’s financial goals and structure.
Best Practice Data Stack
At Data Never Lies, we understand that CFOs need more than reports — they need clear, connected insights to guide financial strategy. That’s why we build scalable data solutions using platforms like NetSuite, SAP, Anaplan, and Power BI, tailored to unify data across FP&A, accounting, and operational teams. From tracking key metrics like EBITDA, cash flow, budget variance, and working capital to building automated board decks and investor-ready dashboards, we help finance leaders move from reactive reporting to proactive decision-making. With our expertise, your data becomes more than organized — it becomes a strategic asset that drives growth, efficiency, and investor confidence.
29 Data Sources
Launch Best-in-Class Chief Financial Officer Company Business Intelligence in Just 48 Hours

Sage Intacct
A cloud financial management solution offering accounting, billing, and reporting tools for growing businesses.

FreshBooks
A user-friendly cloud-based accounting software focused on invoicing, expense tracking, and financial reporting for freelancers and small businesses.

Xero
A cloud-based accounting platform providing tools for bookkeeping, invoicing, and financial tracking for businesses.

ADP Workforce Now
A comprehensive HR management platform integrating payroll, recruitment, and benefits administration for businesses.

Wave
Free accounting software for small businesses, featuring invoicing, receipt tracking, and basic payroll capabilities.

Kashoo
Simplified cloud accounting software for freelancers and small businesses, offering invoicing, expense tracking, and reporting.

Zoho Books
loud-based accounting software for small businesses, offering automated workflows and multi-currency support.

Paycom
Cloud-based HR and payroll platform offering employee self-service and automated compliance tools.

Gusto
Payroll and HR platform for small businesses, providing benefits management and employee onboarding tools.

Apple App Store
A digital distribution platform for iOS apps, providing analytics, reviews, and user engagement insights.
97 Metrics
Launch Best-in-Class Chief Financial Officer Company Business Intelligence in Just 48 Hours
RGR
Revenue Growth Rate: Measures the percentage increase in revenue over a specific period, indicating business expansion or contraction.
NPM
Net Profit Margin: Percentage of revenue left after all expenses, showing a company’s profitability efficiency.
OCF
Operating Cash Flow: Cash generated from core business operations, reflecting financial health and sustainability.
COGS
ost of Goods Sold (COGS): Direct costs of producing goods or services sold, excluding overhead or non-production expenses.
ART
Accounts Receivable Turnover: Frequency of collecting receivables, indicating customer payment efficiency.
APT
Accounts Payable Turnover: Measures how quickly a company pays suppliers, reflecting financial management efficiency.
BV
Budget Variance: Difference between planned and actual figures, identifying financial discrepancies in budgeting.
EBITDA
EBITDA (Earnings Before Interest, Taxes, Depreciation, and Amortization): Profitability metric excluding non-operational expenses for clearer operating performance insights.
EB
Expense Breakdown: Categorization of costs to analyze spending patterns and control expenses effectively.
WC
Working Capital: Current assets minus current liabilities, indicating liquidity and short-term financial health.
DTER
Debt-to-Equity Ratio: Measures financial leverage by comparing total debt to shareholders’ equity.
PBPOSL
Profitability by Product or Service Line: Analysis of revenue versus expenses per product/service to evaluate performance.
ROI
Return on Investment (ROI): Measures profitability of an investment relative to its cost, expressed as a percentage.
CapEx
Capital Expenditures (CapEx): Funds spent on acquiring or upgrading physical assets to sustain or grow business operations.
FCF
Free Cash Flow (FCF): Cash remaining after operating expenses and capital expenditures, indicating financial flexibility.
40 Charts
Launch Best-in-Class Chief Financial Officer Company Business Intelligence in Just 48 Hours
Revenue Growth Over Time
Visualizes revenue changes monthly or quarterly, highlighting trends and growth patterns.
Net Profit Margin by Quarter
Compares profitability efficiency across quarters to track financial health improvements or declines.
Cash Flow Over Time
Displays monthly cash inflows and outflows, showing liquidity trends.
Receivable Turnover Over Time
Tracks how quickly receivables are collected over specific periods.
COGS by Product Line
Breaks down production costs per product, identifying profitability variations.
Payable Turnover Over Tim
Shows the speed of payments to suppliers, revealing financial management trends.
Budget vs Actual Spend
Highlights variances between planned and actual expenditures for better financial control.
Expenses by Category
Categorizes spending, showing proportions of costs for financial analysis.
Working Capital Over Time
Tracks liquidity changes, revealing operational financial health trends.
Debt-to-Equity Over Time
Visualizes shifts in financial leverage across quarters.
Profitability by Product
Compares profit margins per product to assess performance.
ROI by Project
Displays investment returns for each project, aiding decision-making.
CapEx Over Time
Tracks capital investments over time, revealing spending patterns.
Free Cash Flow Over Time
Shows available cash after expenditures, indicating financial flexibility trends.
Revenue per Employee Over Time
Analyzes workforce productivity by tracking revenue generated per employee.
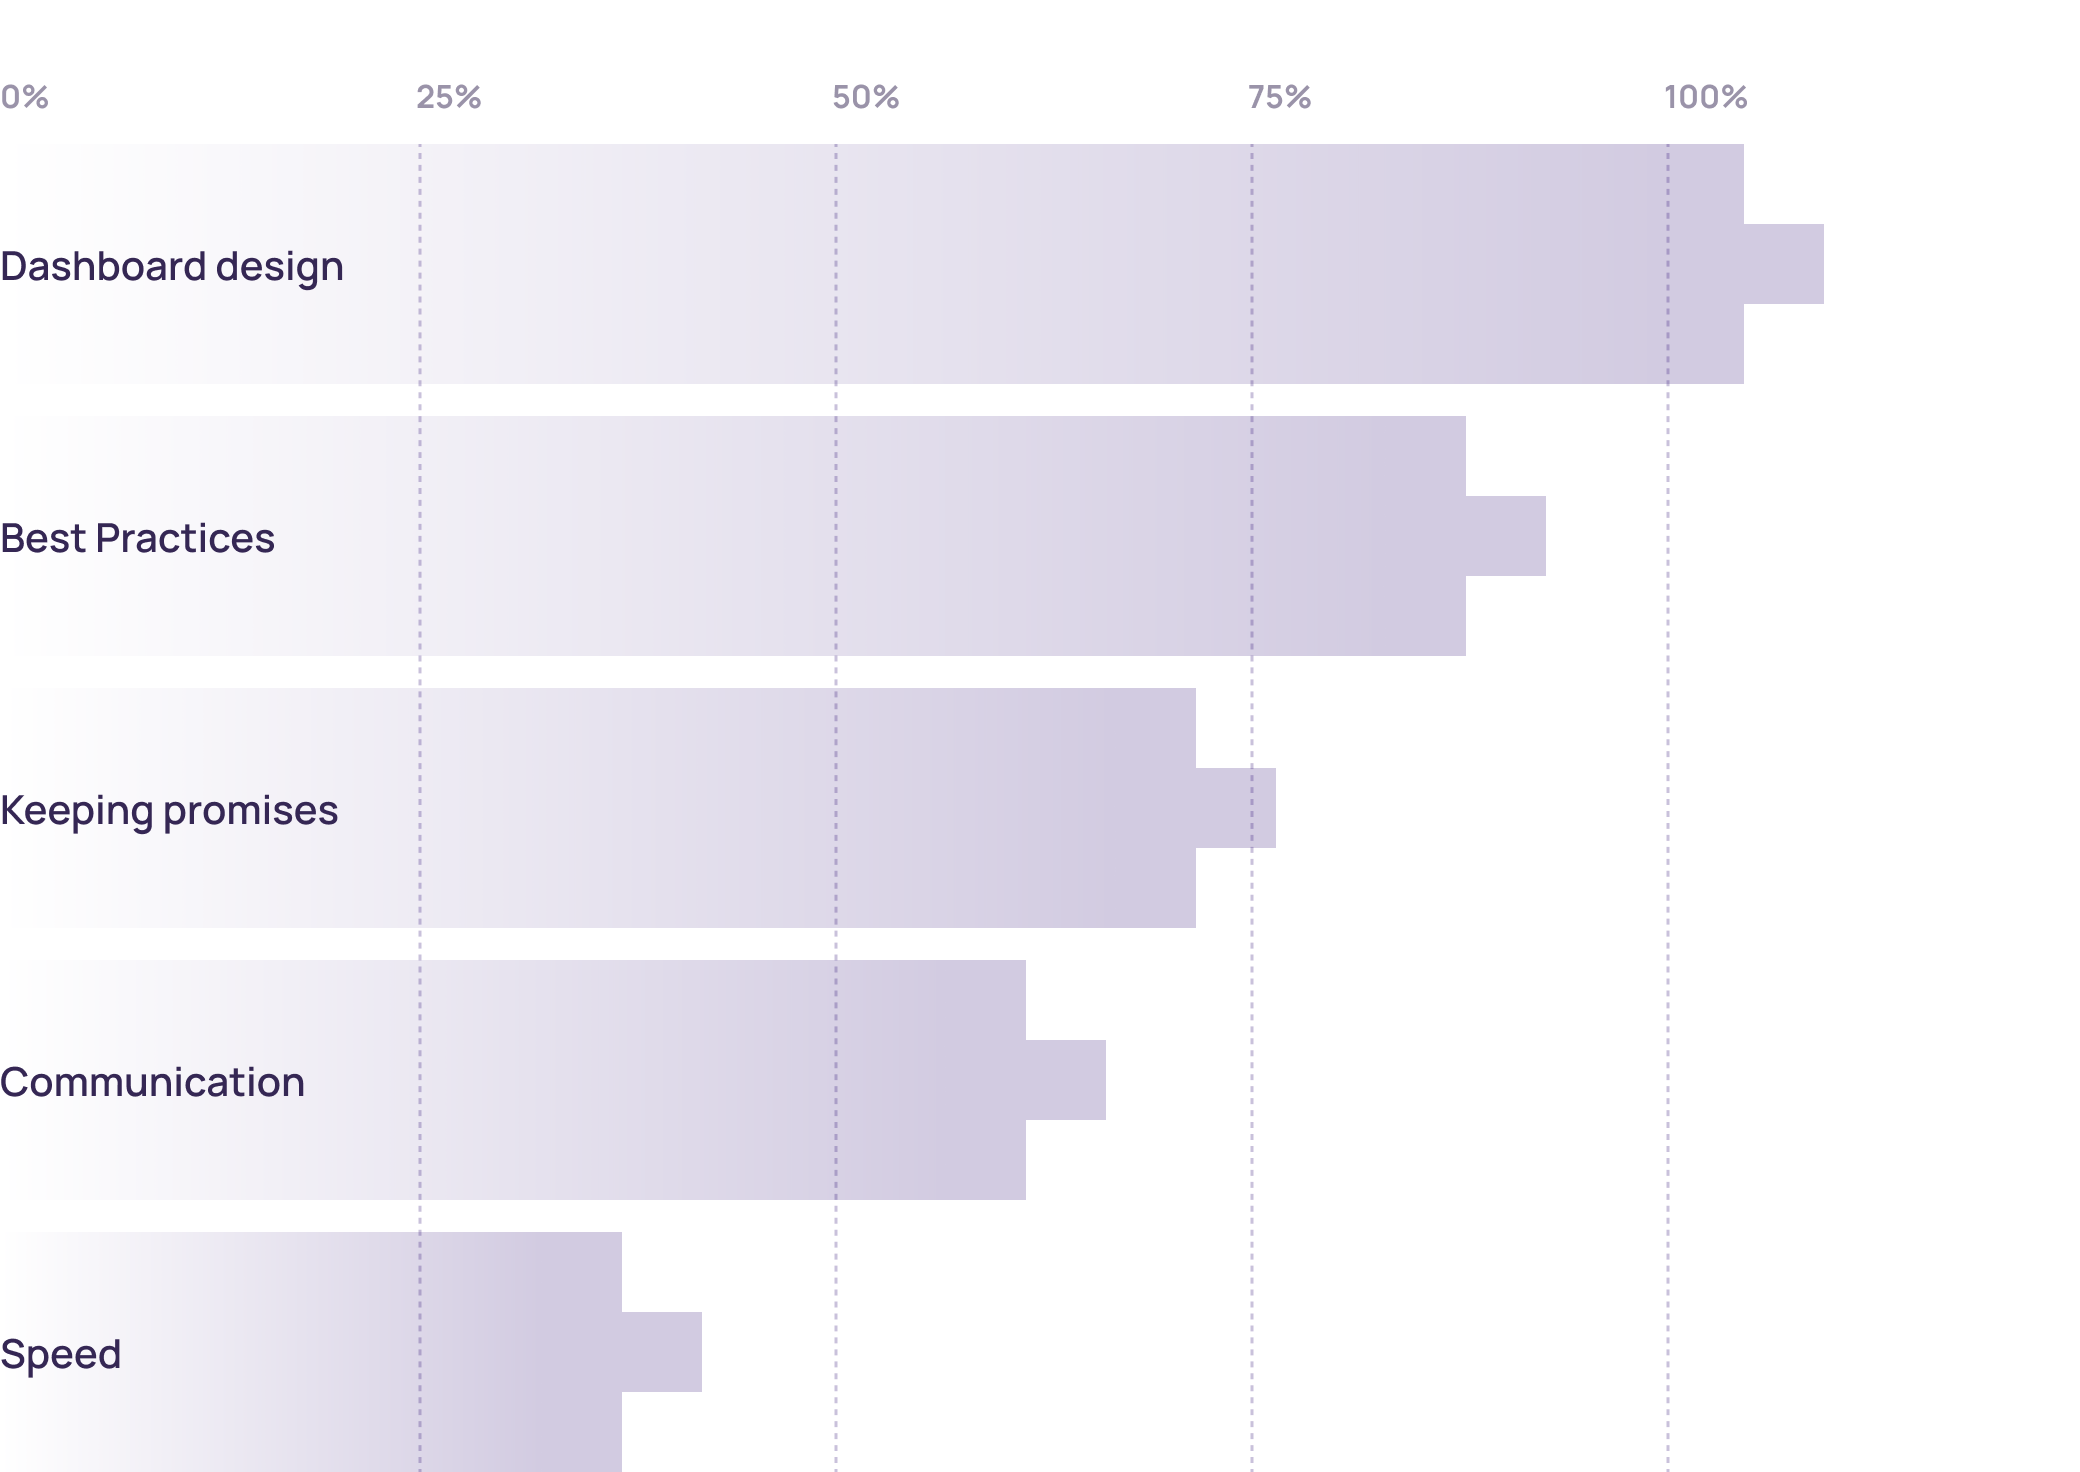
Why customers love us (>100 reviews)
We’ve identified the top five reasons why our clients choose to work with us and continue partnering with us for years.
Our Team
18.
Industry Experts
Our team includes experts with deep knowledge of Chief Financial Officer industry. These professionals bring years of experience in Chief Financial Officer, ensuring that we understand your unique challenges and opportunities. Their expertise enables us to deliver tailored BI solutions that address your specific needs and drive meaningful business outcomes.
28.
Visualization Tools
We utilize a wide range of visualization tools to present your data effectively. Our toolkit includes industry-leading software such as Tableau, Power BI, and D3.js, allowing us to create interactive and engaging visualizations. These tools help you explore your data in depth, uncover insights, and communicate findings clearly to stakeholders, facilitating better decision-making across your organization.
50.
Data Engineering Tools
Our engineers use the best tools available to manage and analyze your data. We leverage technologies such as Apache Hadoop, Spark, and SQL databases to handle large volumes of data efficiently. Our data engineering capabilities ensure that your data is cleaned, transformed, and ready for analysis, enabling you to gain accurate and actionable insights from your BI initiatives.
5.
Languages
We offer services in English, Spanish, French, German, and Russian. Our multilingual team ensures that language barriers do not impede your access to top-quality BI solutions. By providing support and documentation in multiple languages, we cater to a diverse client base and ensure effective communication throughout the project lifecycle. This multilingual approach helps us deliver personalized and accessible services to clients worldwide.
24.
Time Zones
Our team operates globally, from Australia to the West Coast, ensuring continuous support. With experts located in multiple time zones, we can provide timely assistance and address your needs around the clock. This global presence ensures that you receive prompt responses to your inquiries, quick resolution of issues, and uninterrupted progress on your BI projects, regardless of your location.
Our Services
Chief Financial Officer Business Inteligence Outsourcing
Outsource your business intelligence needs to us and focus on your core business activities. Our BI outsourcing services provide you with expert support in managing, analyzing, and interpreting your data. We handle everything from data integration and dashboard creation to advanced analytics and reporting, ensuring that you can leverage data insights without the need for in-house expertise. This allows you to concentrate on strategic initiatives while we manage your BI functions efficiently.
Project Length Starting from 1 Week
Flexible project durations to fit your needs. Whether you require a quick, focused engagement or a long-term partnership, we can tailor our services to match your timeline. Our agile approach allows us to deliver high-quality BI solutions within short timeframes, ensuring that you can address pressing business challenges and capitalize on opportunities promptly.
Educational Programs on Decision-Making
Improve your decision-making skills with our specialized educational programs. Our programs are designed to equip you and your team with the knowledge and tools needed to make data-driven decisions confidently. Through workshops, training sessions, and seminars, we cover topics such as data analysis techniques, interpreting BI reports, and applying insights to business strategies. These educational initiatives help you build a data-centric culture within your organization, empowering you to make better decisions and drive success.