Launch Best-in-Class Call centers Business Intelligence in Just 48 Hours
34
Data Sources
59
Metrics / KPIs
61
Charts
2
AI decision making assistants
Launch Best-in-Class Call centers Business Intelligence in Just 48 Hours
34
Data Sources
59
Metrics / KPIs
61
Charts
2
AI decision making assistants
How many patients are visiting our clinic each month?
What percentage of claims are being denied by insurers?
How much revenue are we generating per patient visit?


Virtual Show Room
If you want to see how top-performing call centers use data to boost efficiency and customer satisfaction, join our showroom session. We’ll walk you through the systems they rely on — like Five9, Genesys, Zendesk, and Power BI — and show how they integrate data from call logs, CRM systems, and support platforms. Together, we’ll explore key metrics such as average handle time, first call resolution, CSAT, agent utilization, and queue performance, and review real dashboards used for team management and service optimization. By the end of the session, we’ll outline a tailored decision-making system built around your call center’s specific goals.
Best Practice Data Stack
At Data Never Lies, we know that in call centers, every second counts — and so does every data point. That’s why we build reliable, scalable data systems using tools like Five9, Genesys, Zendesk, and Power BI — designed to track the KPIs that matter most, like average handle time, first call resolution, CSAT, and agent occupancy. From integrating call logs and CRM data to visualizing team performance and queue trends in real time, we help you turn raw data into clear, actionable insights. With our support, your data becomes a powerful tool to boost service quality, agent efficiency, and customer satisfaction.
34 Data Sources
Launch Best-in-Class Call centers Company Business Intelligence in Just 48 Hours
Five9
A cloud-based contact center platform offering AI-driven solutions for customer engagement and call management.
Genesys
A customer experience platform providing tools for omnichannel communication, automation, and workforce optimization.
Talkdesk
A cloud-based contact center solution focused on enhancing customer interactions through AI and advanced analytics.

NICE inContact
A cloud contact center platform specializing in omnichannel routing, analytics, and workforce optimization.

Avaya
A communications platform offering solutions for contact centers, unified communications, and collaboration.

RingCentral
A cloud-based communication and collaboration platform offering phone, video, and messaging services.

Aircall
A cloud-based phone system tailored for teams, integrating seamlessly with CRM and helpdesk tools.

Twilio
A cloud communications platform enabling developers to build SMS, voice, and video applications.

Freshdesk
A customer support software designed for multichannel communication, automation, and ticketing.

Qualtrics
A customer experience management platform for creating surveys and analyzing feedback to drive business decisions.

Google Forms
A free online tool for creating and distributing surveys or forms, with built-in response tracking.

Typeform
A user-friendly survey tool for creating visually appealing, interactive forms and quizzes.

Medallia
A customer experience platform that collects and analyzes feedback across touchpoints to improve customer satisfaction and loyalty.

SurveyMonkey
An online survey tool for creating, distributing, and analyzing feedback from customers and employees.
59 Metrics
Launch Best-in-Class Call centers Company Business Intelligence in Just 48 Hours
AOR
Agent Occupancy Rate: The proportion of an agent’s time spent actively handling calls or tasks versus idle time.
SLA
Service Level Agreement (SLA) Compliance: Tracks adherence to agreed performance standards, like response time or resolution speed.
ASA
Average Speed of Answer (ASA): The average time customers wait before their call is answered by an agent.
CVBC
Call Volume by Channel: The number of customer interactions received through each communication channel, such as phone or chat.
CRR
Customer Retention Rate: The percentage of customers retained over a specific time, reflecting loyalty and satisfaction.
FCR
First Call Resolution Rate (FCR): Measures the percentage of customer issues resolved during the first interaction, without follow-ups.
AHT
Average Handle Time (AHT): The average duration of a customer interaction, including hold time and after-call work.
CSAT
Customer Satisfaction Score (CSAT): A metric indicating customer satisfaction based on feedback collected after interactions or transactions.
NPS
Net Promoter Score (NPS): Measures customer loyalty by asking how likely they are to recommend a service or product.
CAR
Call Abandonment Rate: The percentage of callers who disconnect before speaking to an agent or receiving service.
ATR
Agent Turnover Rate: The rate at which agents leave their positions, impacting team stability and training costs.
CPC
Cost per Contact: The average cost incurred by the company to handle a single customer interaction.
QTPC
Queue Time per Call: The average time a caller spends waiting in the queue before speaking to an agent.
CES
Customer Effort Score (CES): Measures how much effort customers exert to resolve their issues or achieve their goals.
RCR
Repeat Call Rate: The percentage of customers who need to call back for unresolved issues, indicating inefficiency or complexity.
61 Charts
Launch Best-in-Class Call centers Company Business Intelligence in Just 48 Hours
FCR Rate Over Time
Tracks first call resolution trends weekly, helping identify efficiency improvements or consistency issues.
AHT Distribution
Compares average handle time across channels, highlighting efficiency or complexity differences in customer interactions.
CSAT by Agent
Displays customer satisfaction scores per agent, revealing individual performance and areas for development.
NPS Over Time
Monitors changes in customer loyalty over time, emphasizing long-term satisfaction trends.
Call Abandonment by Time Period
Shows abandonment trends across time periods to identify peak issues or improvement areas.
Occupancy Rate by Agent
Highlights how effectively agents utilize their time handling tasks and interactions.
SLA Compliance Over Time
Tracks adherence to service agreements weekly, ensuring consistent performance standard.
ASA by Hour
Displays hourly average answer speed, pinpointing bottlenecks during specific times.
Call Volume by Channel
Compares communication channel usage, illustrating customer preferences and resource allocation needs.
Retention Rate by Month
Tracks monthly customer retention to evaluate loyalty and long-term satisfaction trends.
Cost per Contact Over Time
Displays cost trends for each customer interaction to manage budgets and efficiency.
Queue Time Distribution
Analyzes call wait times, revealing patterns that impact customer experience.
CES by Month
Shows monthly customer effort scores, emphasizing ease of resolution trends.
Repeat Call Rate by Channel
Compares repeat interaction rates across channels, highlighting areas needing process improvement.
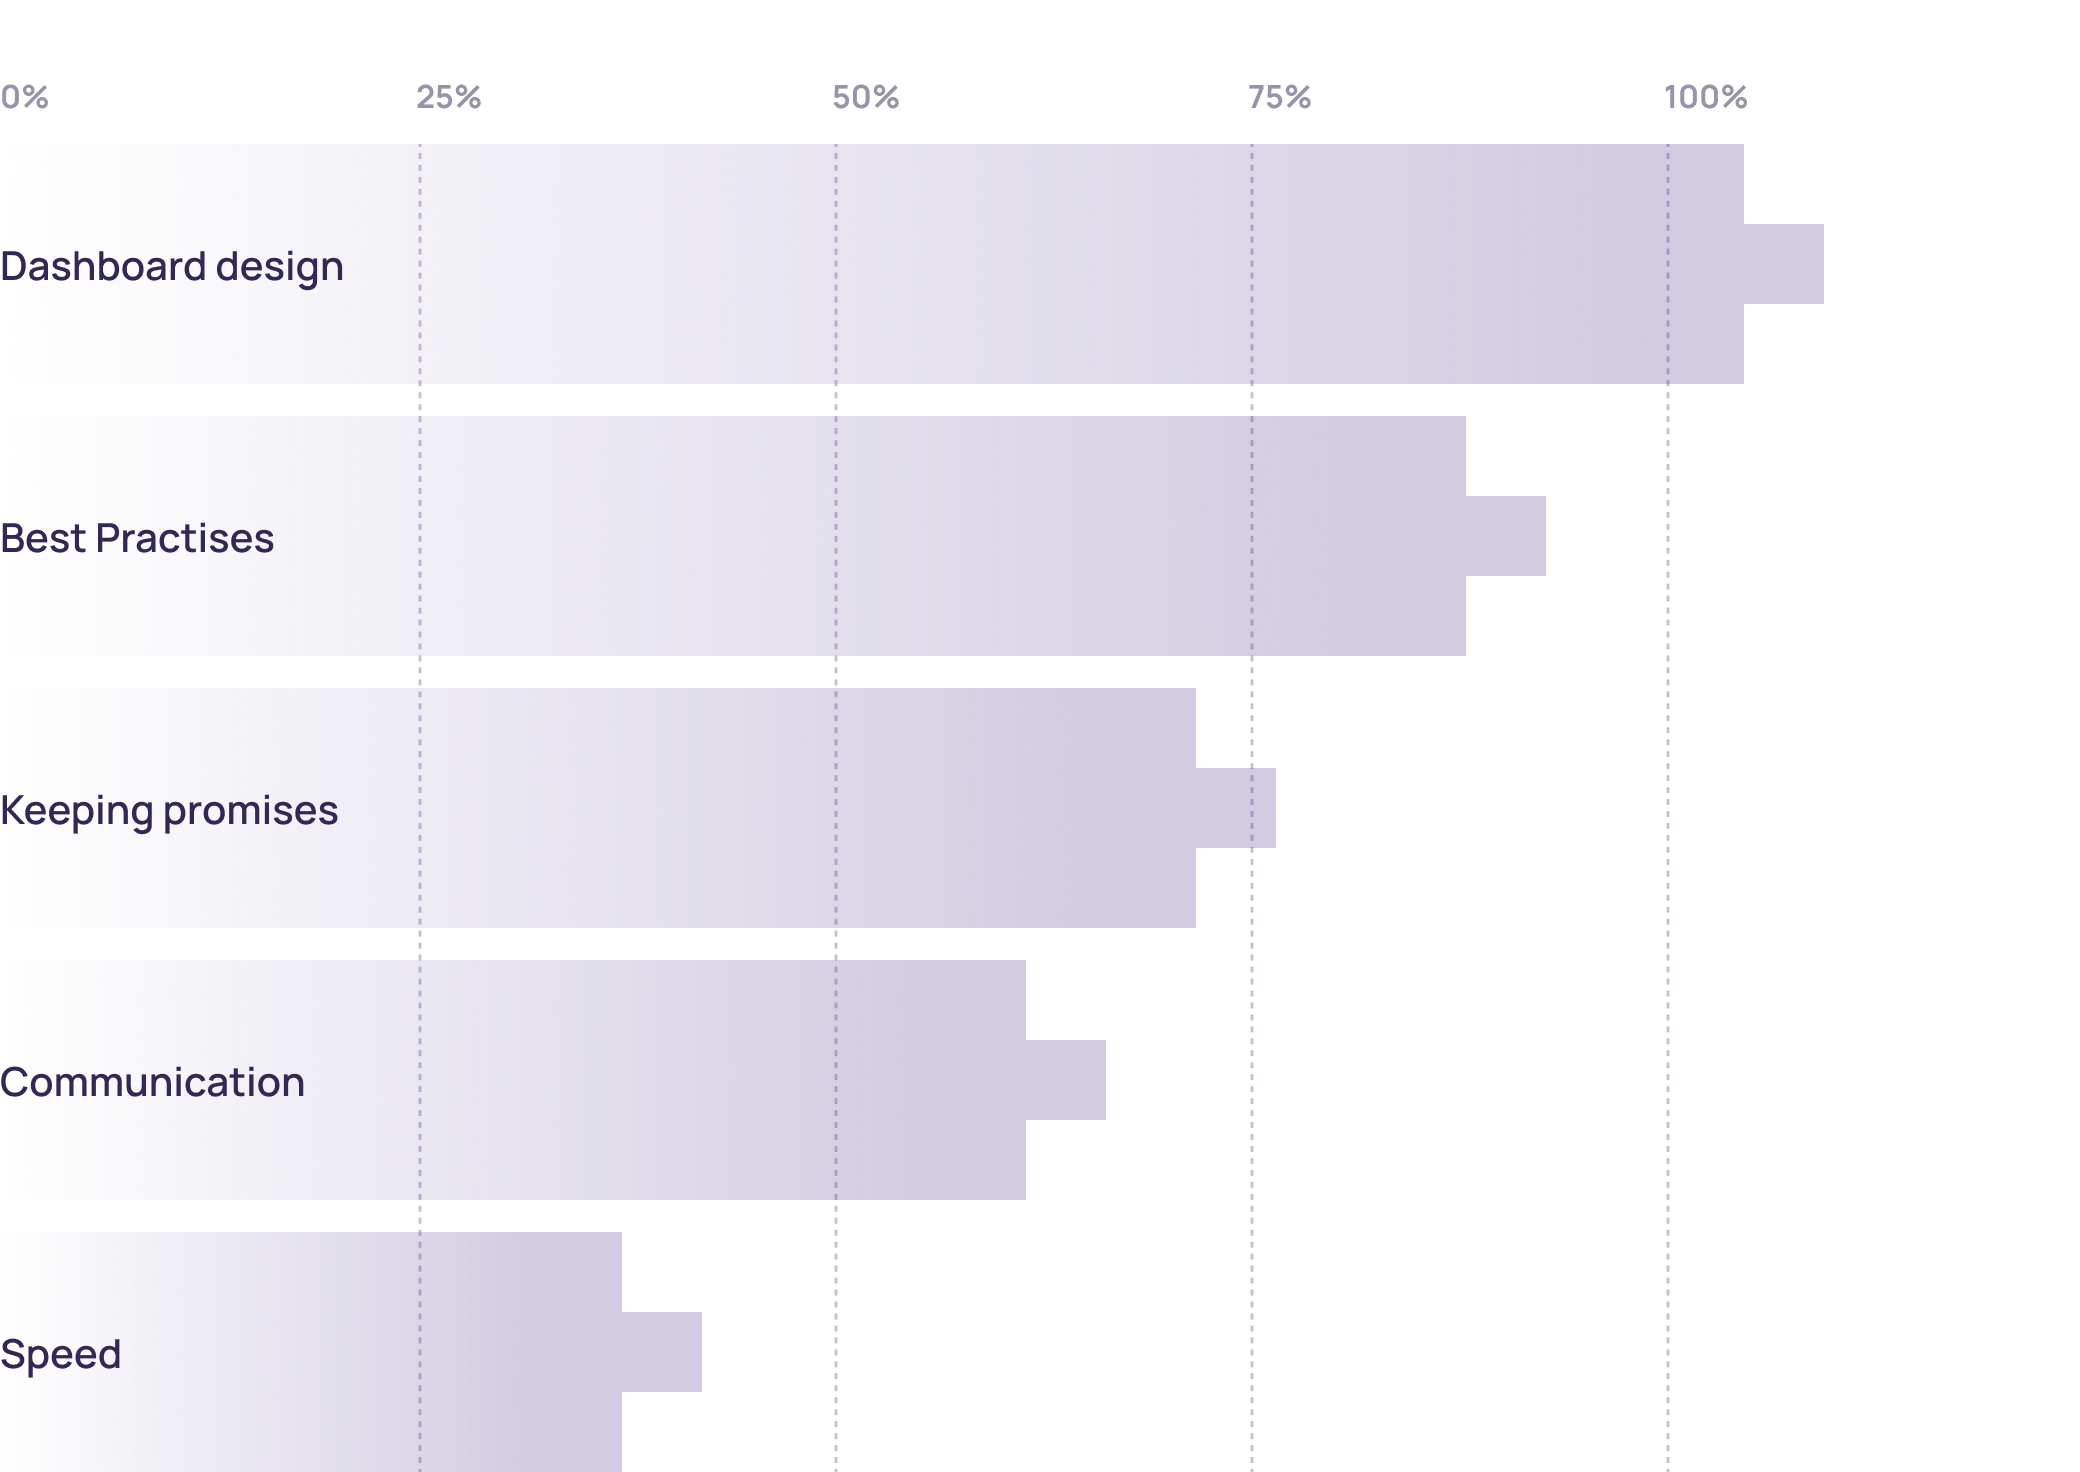
Why customers love us (>100 review)
We’ve identified the top five reasons why our clients choose to work with us and continue partnering with us for years.