Top 10 Data Visualization & Business Intelligence Company in the US 🇺🇸    Top 3 Data Visualization & Business Intelligence Company in the UK 🇬🇧    Top-Rated BI Company on Upwork 🌍    Top 10 Data Visualization & Business Intelligence Company in the US 🇺🇸    Top 3 Data Visualization & Business Intelligence Company in the UK 🇬🇧    Top-Rated BI Company on Upwork 🌍   
Top 10 Data Visualization & Business Intelligence Company in the US 🇺🇸   Top 3 Data Visualization & Business Intelligence Company in the UK 🇬🇧   Top-Rated BI Company on Upwork 🌍

Top 10 Data Visualization & Business Intelligence Company in the US 🇺🇸    Top 3 Data Visualization & Business Intelligence Company in the UK 🇬🇧    Top-Rated BI Company on Upwork 🌍    Top 10 Data Visualization & Business Intelligence Company in the US 🇺🇸    Top 3 Data Visualization & Business Intelligence Company in the UK 🇬🇧    Top-Rated BI Company on Upwork 🌍   Top 10 Data Visualization & Business Intelligence Company in the US 🇺🇸    Top 3 Data Visualization & Business Intelligence Company in the UK 🇬🇧    Top-Rated BI Company on Upwork 🌍    Top 10 Data Visualization & Business Intelligence Company in the US 🇺🇸     Top 3 Data Visualization & Business Intelligence Company in the UK 🇬🇧    Top-Rated BI Company on Upwork 🌍Top 10 Data Visualization & Business Intelligence Company in the US 🇺🇸    Top 3 Data Visualization & Business Intelligence Company in the UK 🇬🇧    Top-Rated BI Company on Upwork 🌍    Top 10 Data Visualization & Business Intelligence Company in the US 🇺🇸    Top 3 Data Visualization & Business Intelligence Company in the UK 🇬🇧    Top-Rated BI Company on Upwork 🌍   Top 10 Data Visualization & Business Intelligence Company in the US 🇺🇸    Top 3 Data Visualization & Business Intelligence Company in the UK 🇬🇧    Top-Rated BI Company on Upwork 🌍    Top 10 Data Visualization & Business Intelligence Company in the US 🇺🇸     Top 3 Data Visualization & Business Intelligence Company in the UK 🇬🇧    Top-Rated BI Company on Upwork 🌍     

Top 10 Data Visualization & Business Intelligence Company in the US 🇺🇸    Top 3 Data Visualization & Business Intelligence Company in the UK 🇬🇧    Top-Rated BI Company on Upwork 🌍    Top 10 Data Visualization & Business Intelligence Company in the US 🇺🇸    Top 3 Data Visualization & Business Intelligence Company in the UK 🇬🇧    Top-Rated BI Company on Upwork 🌍   Top 10 Data Visualization & Business Intelligence Company in the US 🇺🇸    Top 3 Data Visualization & Business Intelligence Company in the UK 🇬🇧    Top-Rated BI Company on Upwork 🌍    Top 10 Data Visualization & Business Intelligence Company in the US 🇺🇸     Top 3 Data Visualization & Business Intelligence Company in the UK 🇬🇧    Top-Rated BI Company on Upwork 🌍Top 10 Data Visualization & Business Intelligence Company in the US 🇺🇸    Top 3 Data Visualization & Business Intelligence Company in the UK 🇬🇧    Top-Rated BI Company on Upwork 🌍    Top 10 Data Visualization & Business Intelligence Company in the US 🇺🇸    Top 3 Data Visualization & Business Intelligence Company in the UK 🇬🇧    Top-Rated BI Company on Upwork 🌍   Top 10 Data Visualization & Business Intelligence Company in the US 🇺🇸    Top 3 Data Visualization & Business Intelligence Company in the UK 🇬🇧    Top-Rated BI Company on Upwork 🌍    Top 10 Data Visualization & Business Intelligence Company in the US 🇺🇸     Top 3 Data Visualization & Business Intelligence Company in the UK 🇬🇧    Top-Rated BI Company on Upwork 🌍     

C-Level Guide: How to build a Decision Engine that can’t be stopped

Indecision is quiet but costly. It drains momentum, blurs accountability, and leaves teams stuck in endless recurring meetings. Still, in many companies, slow decision-making is business as usual.

The problem becomes sharper when the reporting (BI) system is set to show dozens of metrics. Instead of guiding action, dashboards glow with charts and colors, and no one knows what to do next.

True business intelligence is not a rear-view mirror. It should be the engine that drives a company forward.

This guide is for leaders who want to shift from hesitation to motion. Here’s a step-by-step guide for building a Decision Engine – a system so strong and automatic that action becomes the natural next step.

From signals to action: the architecture of a Decision Engine

At the heart of this engine lies a simple but powerful sequence:

Data Aggregation → Data Visualization → Signal → Insight → Action

  • Data Aggregation: Raw data flows in from tools like HubSpot, Shopify, Jira, Snowflake or ERP systems.
  • Data Visualization: Dashboards surface the most relevant metrics in clear, actionable layouts.
  • Signal: Something changes. A drop in conversion rate. A spike in churn. A budget overrun.
  • Insight: Why did it happen? Because paid search is underperforming. Because onboarding emails stopped sending. Because procurement delayed a shipment.
  • Action: What do we do now? Shift budget to organic channels. Fix the email logic. Escalate supplier negotiations. Shift budget to organic channels. Fix the email logic. Escalate supplier negotiations.

This chain must happen quickly, frequently, and with as little friction as possible. In a well-oiled system, most decisions should not require five meetings and a three-page memo. They should be executed within hours, sometimes minutes.
 

Find out if your system is set up right

Book a free Reporting & Dashboards audit to see how well your reporting aligns with your business processes (1-10).

The five levels of Decision-Making

Decisions are not created equal. There are five typical levels, each with its own timeline and stakes:

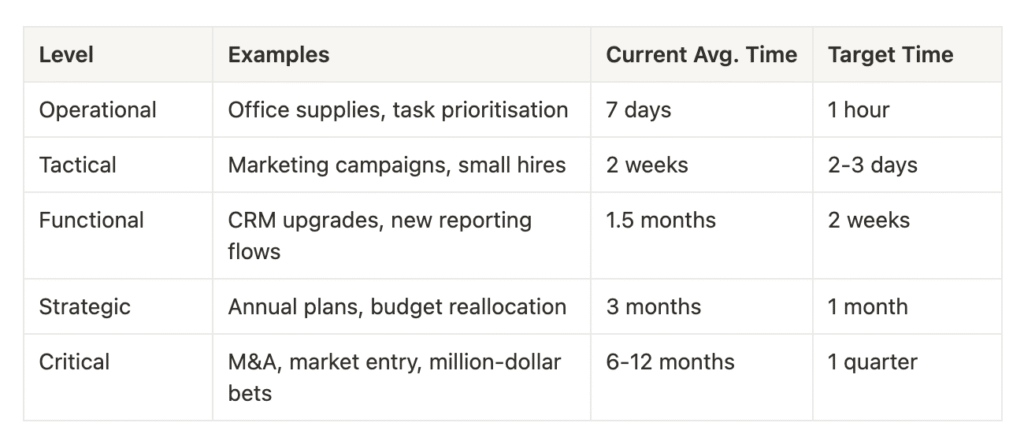
The problem is not just speed, it’s waste of resources. Companies spend weeks in decision loops where nothing moves forward. An approval for a $3,000 tool drags for ten days. By then, the opportunity is lost.

“We’ve worked with firms where operational decisions were still waiting for legal review after two weeks. They could have made the money back ten times just by moving faster.”

Why Business Intelligence often fails

The irony is painful: companies spend hundreds of thousands on BI systems that make no measurable impact on how they actually operate. The reason is rarely technical.
The core issues:
  • No signal clarity: Dashboards flood users with data but lack meaningful triggers.
  • No insight layer: There’s no process (or people) converting data into why-things-happened.
  • No action ownership: Insights float around, unclaimed by any team.
 

“Visualising data is easy. Connecting it to decisions is hard. Most BI tools stop at colouring the numbers. They don’t tell you what to do with them.”

Auditing your speed to decide

The first step in fixing the machine is measurement. Before deploying AI, automations or new dashboards, executives must answer a simple question:

How long does it currently take us to make a decision?

And more precisely:

  • What kinds of decisions are being made?
  • Who is responsible
  • How many hours, emails, and meetings does each one require?
 
Our team recently audited a mid-sized European SaaS company. Their average time to approve a tactical decision (e.g. launching a $5,000 campaign) was 12 business days. Post-audit and BI restructuring, it dropped to 43.5 hours. The difference? Clear signals, simple insight flows, and pre-approved action protocols.

Audit your decision-making speed & metrics

Book a free Reporting & Dashboards audit to see how well your reporting aligns with your business processes (1-10).

Three Industries, Three Engines

SaaS: Product-Led Growth Moves

At a Berlin-based B2B SaaS firm, weekly user churn was quietly rising. A BI-triggered signal showed a 7.8% jump in cancellations within the 7-day onboarding window. The insight? A Zapier integration rolled out the week prior had broken user flows.
The action was swift: the product team rolled back the release, notified users, and updated test protocols. Time from signal to fix: 36.75 hours.
Simultaneously, the AI co-pilot suggested shifting acquisition budget from Google Search to YouTube Shorts (based on cost-per-signup data). The “Fast-First Funnel” campaign launched within 61 hours, and within a week, CPL dropped from €112 to €68.

Manufacturing: Delays Detected Before They Happen

At a Midlands-based electronics manufacturer, a mid-week signal flagged an increase in late-stage component shortages. Insight dashboards revealed a single supplier had failed to meet batch QC thresholds for two consecutive cycles.
Using a BI-integrated action library, procurement reallocated contracts to a secondary ISO-certified supplier within 54.5 hours.
Separately, operations reviewed takt-time shifts across two production lines. The root cause was traced to outdated machine firmware not syncing with predictive maintenance tools (SensrTech v2.4). Firmware updates were issued site-wide by the following Monday.
 

E-commerce: Reacting to Customer Signals in Real Time

An e-commerce brand selling specialty cookware noticed a drop in mobile checkout rates over the weekend. The BI platform alerted the team to a spike in abandoned carts for iOS Safari users.
A/B testing showed that a promotional overlay on the home page interfered with Apple’s browser caching. The team disabled the overlay, pushed an emergency UX fix and notified affected users within 29.5 hours.
In parallel, their marketing team received a recommendation from the AI module to revive a previously paused Meta campaign named “Autumn Cooks” targeted at 35-44 female buyers in Tier 2 cities. CTRs rebounded from 0.89% to 1.71% in three days.

The Human Variable

Culture kills more BI initiatives than technology. Many teams still operate in fear of being wrong. Executives demand certainty in uncertain domains. That’s not just inefficient; it’s toxic.

“We started measuring not only how fast decisions were made, but also how many were delayed due to fear. In one firm, 68% of delays came from mid-level managers unwilling to commit without another layer of approval.”

Leaders must normalise failure. Share experiments. Talk about bets that didn’t work. Make it acceptable to say: “This might fail, but it’s worth testing.”

See the potential of your reporting system

Book a free Reporting & Dashboards audit to see how well your reporting aligns with your business processes (1-10).

Enter AI (but keep your brain on)

AI can help. It can surface anomalies, generate options, draft forecasts. But let’s be clear: it’s not a decision-maker. At best, it’s a tireless analyst.
The most productive model we’ve seen is a human-AI loop:
  1. AI generates 10 options based on goals and data.
  2. Decision-makers critique each.
  3. Feedback is looped back to improve future suggestions.
  4. The cycle repeats until quality stabilises.

“We use this with our clients: AI proposes 10 campaign strategies. The marketing lead reviews, gives context, rules out three, adapts two. By the third cycle, the suggestions are uncannily relevant.”

But this only works if the company tracks which decisions were made, what outcomes followed, and feeds that history back into the system. Without feedback, AI is just noise.

What a Decision Engine Feels Like

When the engine runs well, here’s what changes:
  • Meetings get shorter. 60-minute debates become 8-minute confirmations.
  • Teams stop asking for permission and start requesting access.
  • Dashboards no longer sit on a screen; they drive morning standups.
  • People act.
At one logistics client, the BI system triggered a drop in delivery punctuality. Insight: one route manager was regularly overriding optimal paths. Action: re-train or reassign. Time from signal to action? 17.5 hours.

“The real ‘wow’ isn’t in the dashboard. It’s when people realise they no longer need five meetings to do what could be done in one.”

Final Thought: Build for Velocity

A company’s ability to grow, adapt, and profit increasingly depends on how fast it can turn data into movement. Not just knowledge. Action.
The Decision Engine isn’t a product you buy. It’s a system you build: slowly, iteratively, and culturally. With the right BI principles, the right measurement mindset, and a bit of leadership courage, it becomes a competitive advantage that’s almost unfair.
And once it starts rolling, it’s very hard to stop.

Want to audit your company’s speed to decide?

We work with executive teams to:
  • Audit current decision timelines
  • Build Signal → Insight → Action pipelines
  • Design BI systems that drive behaviour, not just data views
Let’s build the engine.

Audit your reporting and dashboards

Book our Reporting & Dashboards audit to see how well your reporting aligns with your business processes (1-10). Zero cost.

Table of Contents

Leave your contact details and we will contact you

Leave your contact details and we will call you back

Menoid Demo Call Form: