Launch Best-in-Class B2B Sales Business Intelligence in Just 48 Hours
48
Data Sources
53
Metrics / KPIs
85
Charts
5
AI decision making assistants
Launch Best-in-Class B2B Sales Business Intelligence in Just 48 Hours
48
Data Sources
53
Metrics / KPIs
85
Charts
5
AI decision making assistants
Which regions are generating the highest sales revenue?
How well are sales reps meeting their sales targets?
What percentage of deals are successfully closed over time?


Virtual Show Room
If you want to see how top B2B sales teams use data to drive pipeline growth and close deals faster, join our showroom session. We’ll walk you through the tools they rely on — like Salesforce, HubSpot, ZoomInfo, and Power BI — and show how they unify data across lead generation, outreach, and deal stages. Together, we’ll explore key metrics like lead-to-opportunity conversion, sales velocity, win rate, and average deal size, and review dashboards that support forecasting, rep performance, and revenue tracking. By the end of the session, we’ll outline a custom decision-making system tailored to your sales process and goals.
Best Practice Data Stack
At Data Never Lies, we know that in B2B sales, every closed deal starts with smart, data-driven decisions. That’s why we build scalable analytics systems using tools like Salesforce, HubSpot, LinkedIn Sales Navigator, and Power BI — customized to track your entire sales funnel. From monitoring lead quality and opportunity stages to analyzing sales velocity, win rates, and rep performance, we design data stacks that bring clarity to your pipeline and forecasting. With our help, your data becomes more than just numbers — it becomes a sales engine that drives alignment, growth, and revenue.
48 Data Sources
Launch Best-in-Class B2B Sales Company Business Intelligence in Just 48 Hours

Chargebee
Chargebee is a subscription management platform that automates billing, invoicing, and revenue operations for businesses with recurring revenue models.

Xero
Xero is cloud-based accounting software that helps businesses manage finances, track expenses, process invoices, and handle payroll.

Recurly
Recurly is a subscription billing platform that helps businesses manage recurring payments, invoicing, and customer subscriptions seamlessly.

Pipedrive
Pipedrive is a sales-focused CRM platform that helps businesses manage leads, track deals, and optimize sales processes.

Zoho CRM
Zoho CRM is a cloud-based customer relationship management platform that helps businesses manage sales, marketing, and customer support processes.

SugarCRM
A customizable CRM platform offering sales, marketing, and support tools for mid-sized and large organizations.

Freshsales
An intuitive CRM by Freshworks, featuring AI-driven insights, pipeline management, and multichannel communication tools.

Copper CRM
A Google Workspace-integrated CRM simplifying lead and deal management for small and medium-sized businesses.

Oracle Primavera
A project scheduling and portfolio management software for planning, managing, and optimizing large-scale construction projects.

HubSpot
HubSpot is a cloud-based platform offering CRM, marketing, sales, and customer service tools to help businesses grow and engage audiences.

Stripe
Stripe is a payment processing platform enabling businesses to accept online payments, manage subscriptions, and handle financial transactions securely.
53 Metrics
Launch Best-in-Class B2B Sales Company Business Intelligence in Just 48 Hours
LCR
Lead Conversion Rate: Percentage of leads turning into paying customers, highlighting the effectiveness of sales and marketing strategies.
SCL
Sales Cycle Length: Average duration from initial prospect engagement to deal closure, measuring efficiency of the sales process.
DWR
Deal Win Rate: Ratio of successfully closed deals to total opportunities, reflecting sales team performance and strategy success.
ADS
Average Deal Size: Average revenue generated per closed deal, showing the monetary value of successful sales transactions.
QAR
Quota Attainment Rate: Percentage of assigned sales targets achieved by individuals or teams within a specific reporting period.
PV
Pipeline Value: Total potential revenue of all active deals in the sales pipeline, reflecting future earning potential.
SFA
Sales Forecast Accuracy: Alignment of predicted sales figures with actual revenue, indicating reliability of forecasting methods.
LRT
Lead Response Time: Average time sales teams take to contact a lead after generation, affecting lead conversion success.
CLTV
Customer Lifetime Value (CLTV): Total projected revenue a business earns from a customer throughout their relationship.
CR
Churn Rate: Percentage of customers lost within a period, impacting overall revenue and growth metrics.
SBR
Sales by Region: Breakdown of revenue generated by geographic area, identifying top-performing locations or underperforming markets.
MROI
Marketing ROI: Measure of profit gained versus marketing expenses, showing the financial effectiveness of campaigns.
SV
Sales Velocity: Metric combining deal size, win rate, and sales cycle, reflecting how quickly revenue is generated.
CTCR
Call-to-Close Ratio: Percentage of sales calls resulting in closed deals, highlighting communication effectiveness in converting prospects.
CAC
Customer Acquisition Cost (CAC): Average cost of acquiring a new customer, considering all marketing and sales expenditures.
85 Charts
Launch Best-in-Class B2B Sales Company Business Intelligence in Just 48 Hours
Conversion Rate by Channel
Bar chart showing the percentage of leads converted by each lead source, highlighting channel effectiveness.
Sales Cycle by Stage
Bar chart displaying the average number of days spent in each sales stage, identifying bottlenecks.
Win Rate Over Time
Line chart tracking the percentage of deals won monthly, showcasing trends in sales success.
Deal Size by Industry
Bar chart comparing average deal sizes across industries, revealing high-value markets.
Quota Attainment by Salesperson
Bar chart displaying the percentage of sales targets achieved by individual team members.
Pipeline Value by Stage
Funnel chart showing revenue potential at each stage of the sales pipeline, emphasizing deal progression.
Forecast vs Actual Sales
Bar chart comparing predicted sales with actual outcomes, highlighting forecasting accuracy.
Response Time by Channel
Bar chart illustrating the average response time for leads by communication channel, evaluating responsiveness.
CLTV by Cohort
Bar chart showing average monthly revenue per customer cohort, tracking long-term customer value trends.
Churn Rate Over Time
Line chart visualizing customer loss percentage monthly, monitoring retention trends.
Sales by Region
Geographic heatmap showing sales performance by area, identifying top-performing and underperforming regions.
ROI by Campaign
Bar chart comparing marketing campaign returns versus investments, highlighting the most cost-effective strategies.
Sales Velocity Over Time
Line chart tracking revenue generation speed weekly, reflecting the efficiency of sales efforts.
Calls vs Closures
Bar chart comparing the number of calls made to deals closed, showing call effectiveness.
CAC by Channel
Bar chart analyzing customer acquisition costs by lead source, identifying the most cost-efficient channels.
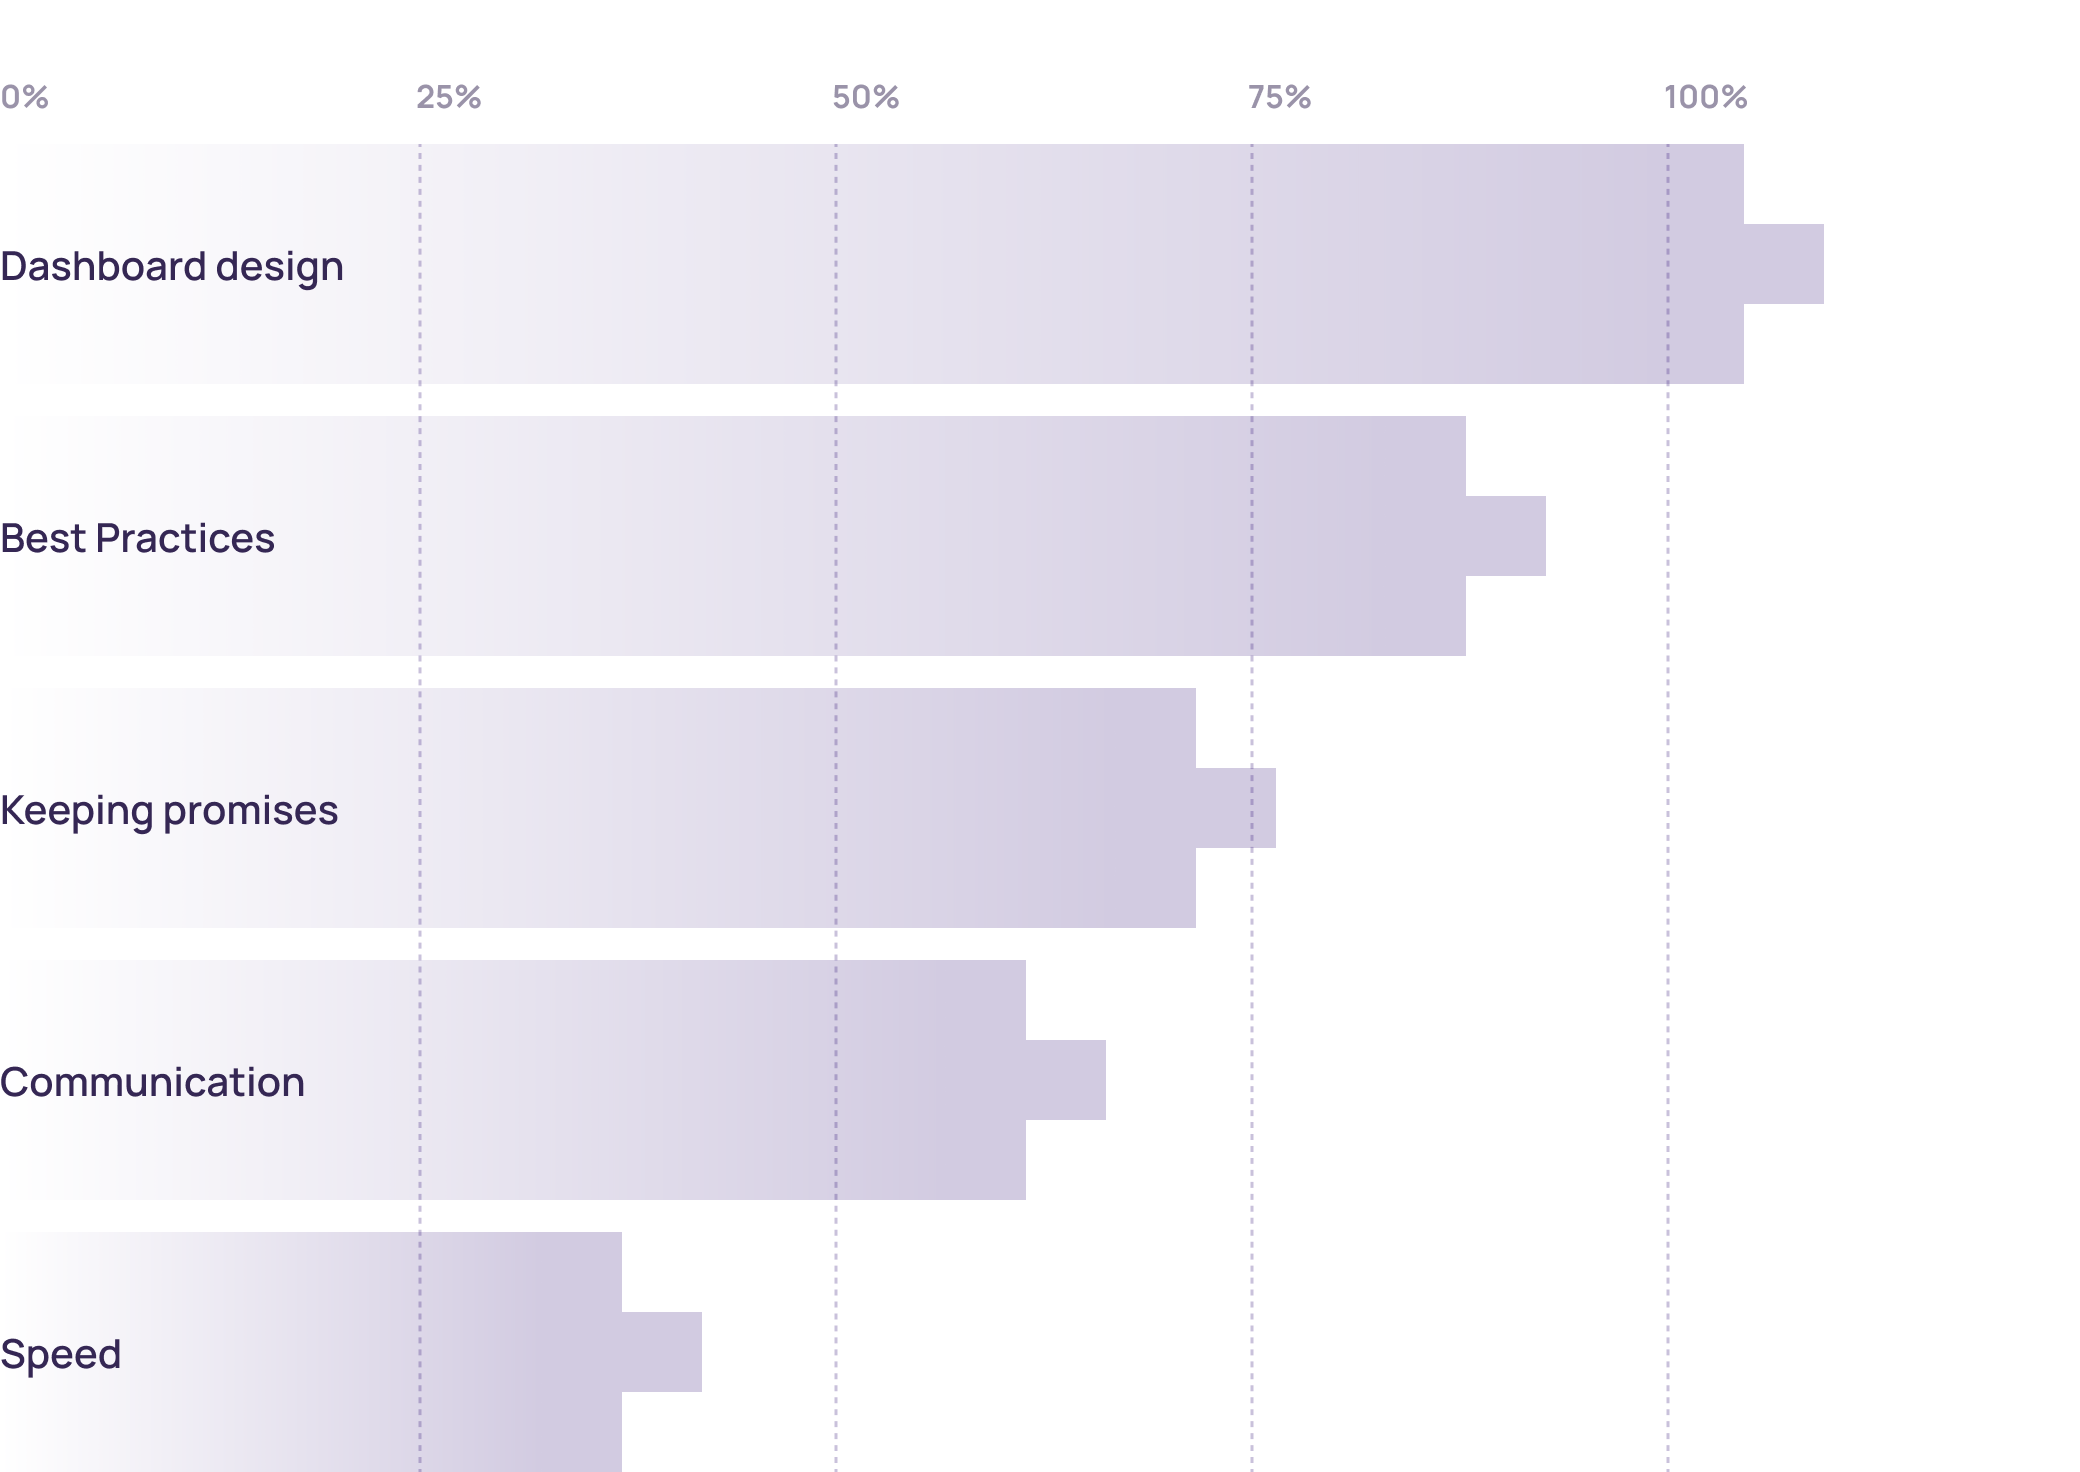
Why customers love us (>100 reviews)
We’ve identified the top five reasons why our clients choose to work with us and continue partnering with us for years.
Our Team
18.
Industry Experts
Our team includes experts with deep knowledge of B2B Sales industry. These professionals bring years of experience in B2B Sales, ensuring that we understand your unique challenges and opportunities. Their expertise enables us to deliver tailored BI solutions that address your specific needs and drive meaningful business outcomes.
28.
Visualization Tools
We utilize a wide range of visualization tools to present your data effectively. Our toolkit includes industry-leading software such as Tableau, Power BI, and D3.js, allowing us to create interactive and engaging visualizations. These tools help you explore your data in depth, uncover insights, and communicate findings clearly to stakeholders, facilitating better decision-making across your organization.
50.
Data Engineering Tools
Our engineers use the best tools available to manage and analyze your data. We leverage technologies such as Apache Hadoop, Spark, and SQL databases to handle large volumes of data efficiently. Our data engineering capabilities ensure that your data is cleaned, transformed, and ready for analysis, enabling you to gain accurate and actionable insights from your BI initiatives.
5.
Languages
We offer services in English, Spanish, French, German, and Russian. Our multilingual team ensures that language barriers do not impede your access to top-quality BI solutions. By providing support and documentation in multiple languages, we cater to a diverse client base and ensure effective communication throughout the project lifecycle. This multilingual approach helps us deliver personalized and accessible services to clients worldwide.
24.
Time Zones
Our team operates globally, from Australia to the West Coast, ensuring continuous support. With experts located in multiple time zones, we can provide timely assistance and address your needs around the clock. This global presence ensures that you receive prompt responses to your inquiries, quick resolution of issues, and uninterrupted progress on your BI projects, regardless of your location.
Our Services
B2B Sales Business Inteligence Outsourcing
Outsource your business intelligence needs to us and focus on your core business activities. Our BI outsourcing services provide you with expert support in managing, analyzing, and interpreting your data. We handle everything from data integration and dashboard creation to advanced analytics and reporting, ensuring that you can leverage data insights without the need for in-house expertise. This allows you to concentrate on strategic initiatives while we manage your BI functions efficiently.
Project Length Starting from 1 Week
Flexible project durations to fit your needs. Whether you require a quick, focused engagement or a long-term partnership, we can tailor our services to match your timeline. Our agile approach allows us to deliver high-quality BI solutions within short timeframes, ensuring that you can address pressing business challenges and capitalize on opportunities promptly.
Educational Programs on Decision-Making
Improve your decision-making skills with our specialized educational programs. Our programs are designed to equip you and your team with the knowledge and tools needed to make data-driven decisions confidently. Through workshops, training sessions, and seminars, we cover topics such as data analysis techniques, interpreting BI reports, and applying insights to business strategies. These educational initiatives help you build a data-centric culture within your organization, empowering you to make better decisions and drive success.