Launch Best-in-Class Airlines Business Intelligence in Just 48 Hours
128
Data Sources
51
Metrics / KPIs
72
Charts
6
AI decision making assistants
Launch Best-in-Class Airlines Business Intelligence in Just 48 Hours
128
Data Sources
51
Metrics / KPIs
72
Charts
6
AI decision making assistants
How efficient is fuel usage across different aircraft types?
What is the average ticket price for each route?
What percentage of flights are arriving on time for each route?


Virtual Show Room
If you want to see how top airlines use business intelligence to optimize operations, improve passenger experience, and increase profitability, join our showroom session. We’ll walk you through the data sources they rely on — ranging from fleet management systems and booking platforms to maintenance logs and flight tracking APIs — and the tools they use, including Power BI and Azure for real-time analytics. Together, we’ll explore key aviation metrics like load factor, on-time performance, yield per passenger, fuel efficiency, and aircraft utilization, and review real dashboards designed for route planning, crew performance, and maintenance forecasting. By the end of the session, we’ll outline a custom decision-making system aligned with your airline’s operational and strategic goals.
Best Practice Data Stack
At Data Never Lies, we believe every successful airline business intelligence strategy starts with a strong data foundation. That’s why we build scalable analytics solutions using platforms like Power BI, Snowflake, and Azure — customized to unify data from flight operations, fleet management, booking systems, and maintenance records. From tracking key metrics like load factor, on-time performance, fuel burn per seat, revenue per available seat kilometer (RASK), and maintenance turnaround time, we help airlines turn complex data into actionable insights. With our expertise, your data isn’t just organized — it becomes a real-time decision-making engine that powers efficiency, safety, and profitability across your airline.
128 Data Sources
Launch Best-in-Class AirlinesS Company Business Intelligence in Just 48 Hours

Travelport
A global travel distribution system that connects airlines, hotels, and travel agencies for booking flights, hotels, and car rentals.

Sabre
A leading travel technology platform offering airline reservation, ticketing, and distribution solutions for travel agencies and airlines worldwide.

Amadeus
A global travel technology company providing booking, reservation, and passenger service solutions for airlines, travel agencies, and hospitality businesses.

IATA Data
Industry data from the International Air Transport Association, including airline schedules, fares, passenger traffic, and operational statistics.

FlightAware
A flight tracking platform providing real-time and historical flight data, including delays, cancellations, and aircraft movements.

SITA
A global IT and communications provider for the airline industry, offering solutions for passenger services, baggage handling, and cybersecurity.

Google Flights
A service that allows developers to access flight search, pricing, and availability data from airlines and online travel agencies.

OAG
A global provider of airline schedules, flight status, and aviation analytics used by airlines, airports, and travel companies.

Navitaire
A technology provider specializing in reservation, revenue management, and digital commerce solutions for low-cost and hybrid airlines.

Zendesk
Zendesk is a customer service platform that provides tools for managing support tickets, live chat, and customer communication across channels.

Salesforce
Salesforce is a cloud-based customer relationship management (CRM) platform enabling businesses to streamline sales, marketing, and service.

SAP
SAP ERP is an enterprise resource planning software that integrates core business processes like finance, supply chain, and operations.

QuickBooks
QuickBooks is accounting software designed to help businesses manage finances, track expenses, create invoices, and generate reports.
51 Metrics
Launch Best-in-Class Airlines Company Business Intelligence in Just 48 Hours
PLF
Passenger Load Factor (PLF) – The percentage of available seating capacity that is actually filled with paying passengers on flights.
OTP
On-Time Performance (OTP) – The percentage of flights that depart and arrive on schedule, measuring airline punctuality and reliability.
RASK
Revenue per Available Seat Kilometer (RASK) – Total revenue generated per available seat kilometer, reflecting the airline’s efficiency in monetizing available capacity.
CASK
Cost per Available Seat Kilometer (CASK) – The operating cost incurred per available seat kilometer, indicating airline efficiency in managing expenses.
ATP
Average Ticket Price – The average fare paid per passenger, calculated across all ticket sales within a specific period.
CSAT
Customer Satisfaction Score (CSAT) – A measure of passenger satisfaction based on feedback regarding service, comfort, and overall experience.
NPS
Net Promoter Score (NPS) – A metric reflecting passenger loyalty and willingness to recommend the airline to others, based on survey responses.
BHA
Baggage Handling Accuracy – The percentage of correctly delivered baggage, measuring airline efficiency in preventing lost or mishandled luggage.
FE
Fuel Efficiency – The amount of fuel consumed per available seat kilometer, indicating cost-effectiveness and environmental impact.
RPP
Revenue per Passenger – The average revenue generated per passenger, including ticket sales and additional purchases.
AR
Ancillary Revenue – Revenue from non-ticket sources, such as baggage fees, seat upgrades, in-flight sales, and loyalty programs.
FCR
Flight Cancellation Rate – The percentage of scheduled flights canceled by the airline, affecting passenger experience and operational efficiency.
SOR
Seat Occupancy Rate – The percentage of available seats that are sold and occupied by passengers during flights.
LPE
Loyalty Program Engagement – The level of passenger participation in airline rewards programs, including miles earned, redemptions, and membership activity.
EP
Employee Productivity – A measure of airline staff efficiency, often calculated as revenue or passengers handled per employee.
72 Charts
Launch Best-in-Class Airlines Company Business Intelligence in Just 48 Hours
Load Factor by Route
Tracks the percentage of occupied seats on flights for different routes over time, indicating passenger demand trends.
On-Time Arrival Rate by Route
Compares the percentage of flights arriving on schedule across different routes, highlighting punctuality performance.
RASK by Route
Displays revenue per available seat kilometer for each route, measuring profitability and pricing efficiency.
CASK by Route
Shows operating cost per available seat kilometer across routes, helping assess cost efficiency in airline operations.
Ticket Price by Route
Compares average ticket prices for different routes, identifying fare variations based on demand and competition.
CSAT by Flight Class
Measures customer satisfaction scores by flight class (economy, business, first), evaluating service quality differences.
NPS by Route
Shows passenger loyalty and likelihood to recommend flights on specific routes, based on survey feedback.
Baggage Handling Accuracy by Route
Compares the percentage of correctly handled baggage across different routes, identifying operational strengths and weaknesses.
Fuel Usage by Aircraft Type
Fuel Usage by Aircraft Type (Bar Chart) – Displays fuel consumption for different aircraft models, assessing efficiency and environmental impact.
Fare Revenue by Passenger
Shows the average revenue earned per passenger across flights, reflecting pricing strategy effectiveness.
Ancillary Revenue by Flight
Compares additional revenue from baggage fees, seat upgrades, and in-flight purchases across flights.
Cancellations by Route
Tracks the number or percentage of canceled flights per route, identifying operational disruptions.
Seat Occupancy by Flight
Shows the percentage of occupied seats per flight, measuring demand and capacity utilization.
Loyalty Engagement by Region
Displays the distribution of frequent flyer participation across regions, highlighting market engagement.
Revenue per Employee
Measures average revenue generated per airline employee, assessing workforce productivity and efficiency.
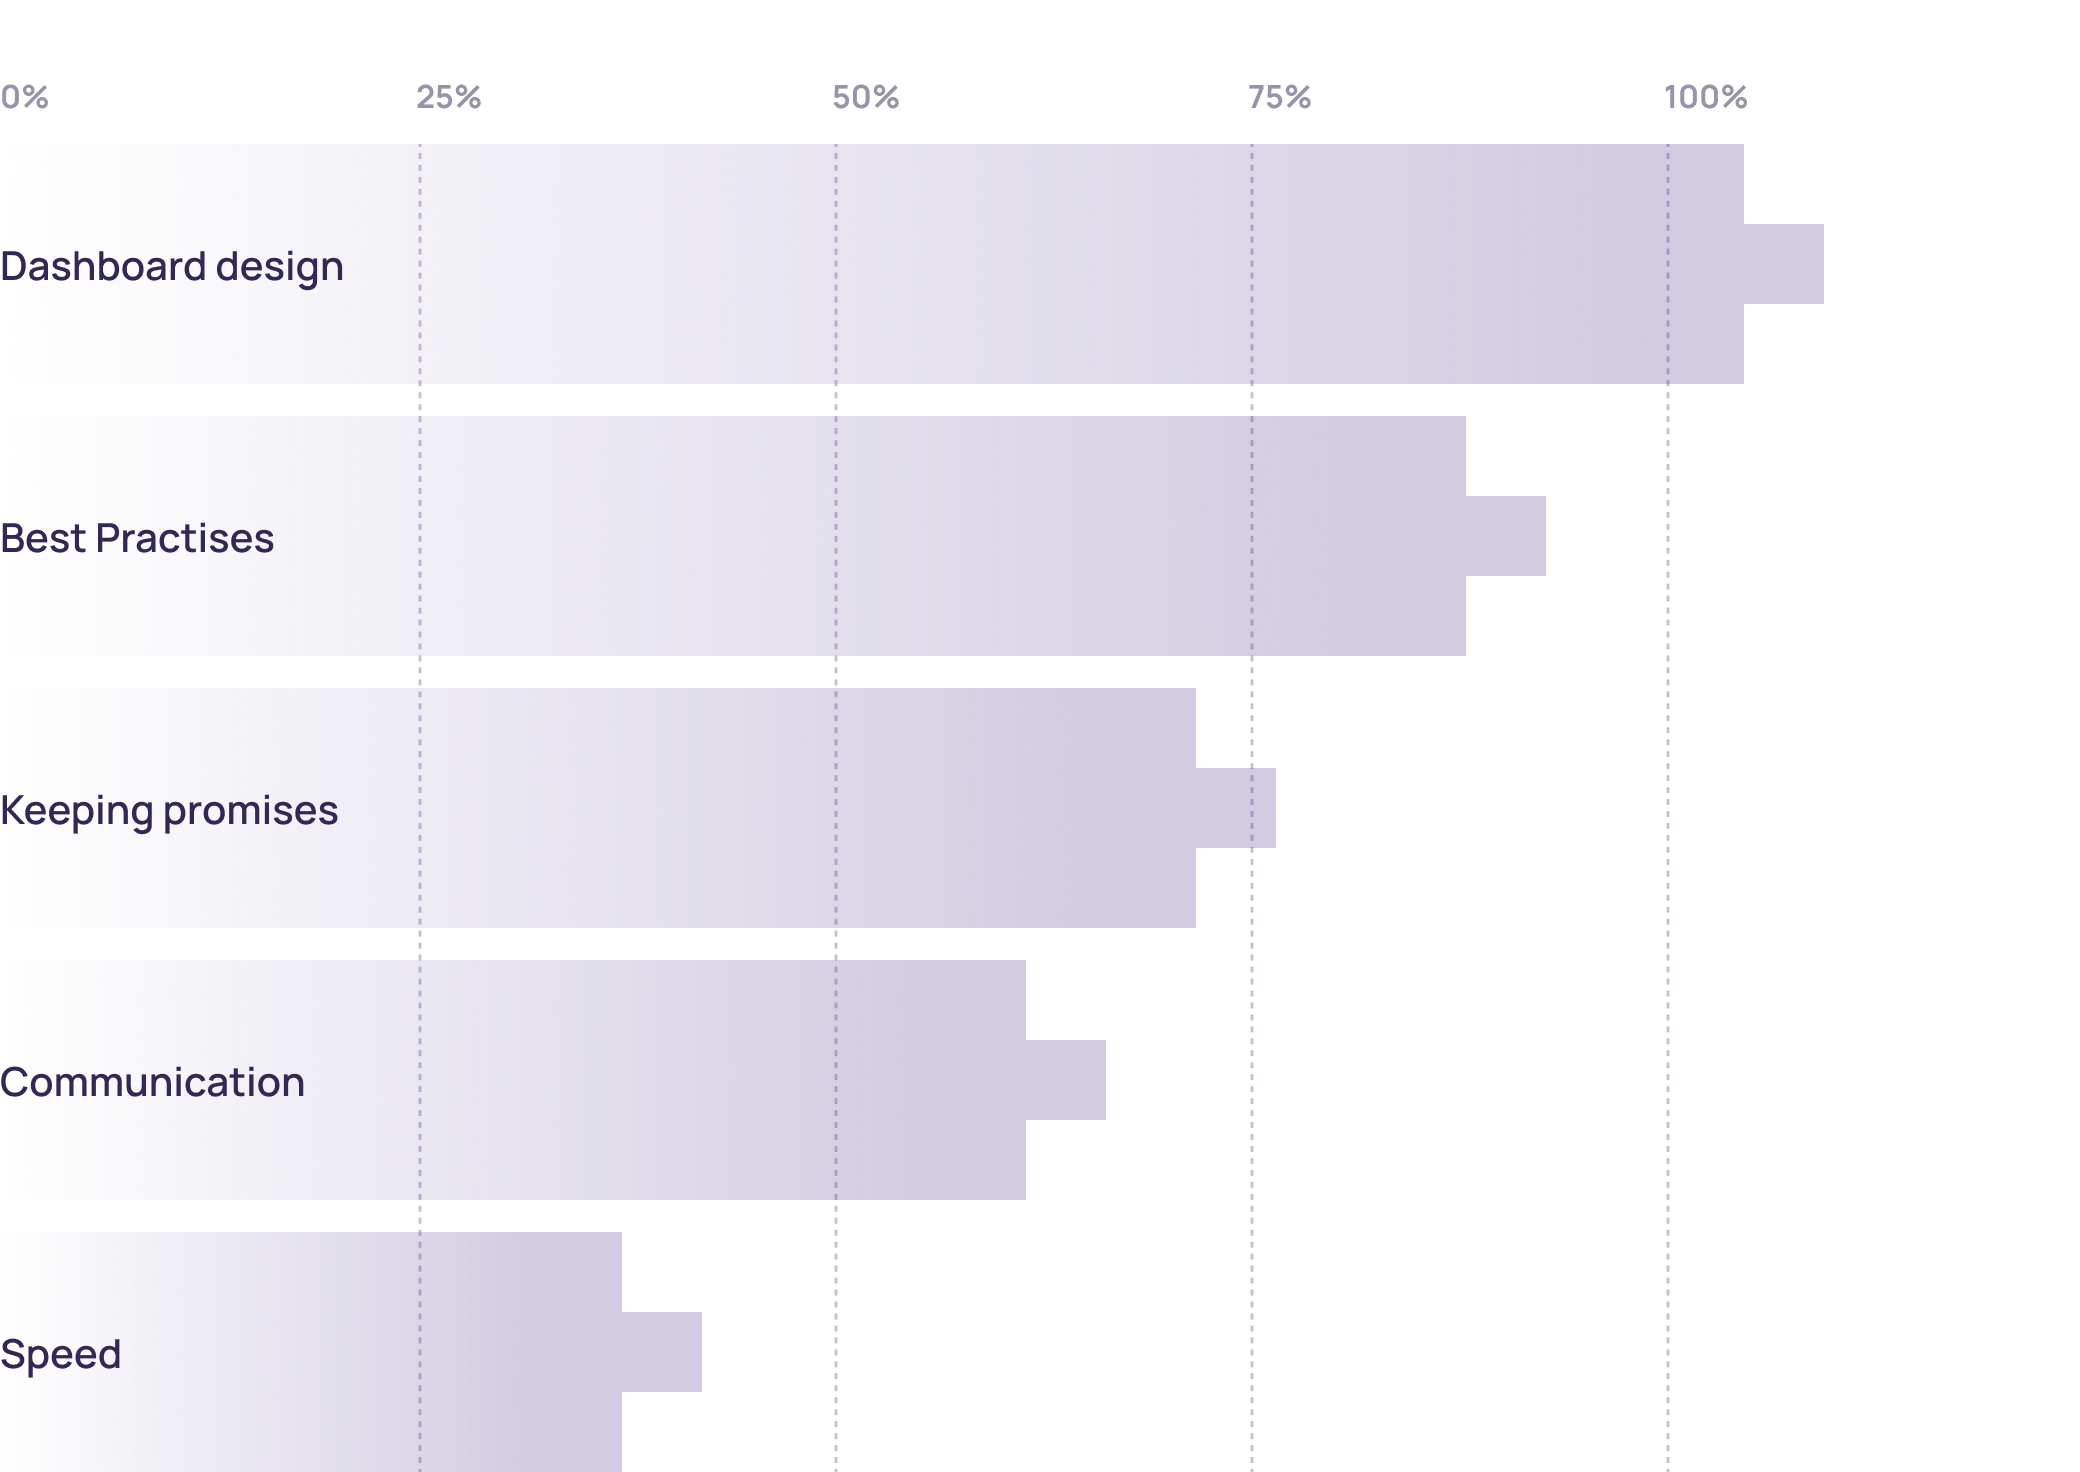
Why customers love us (>100 review)
We’ve identified the top five reasons why our clients choose to work with us and continue partnering with us for years.