Launch Best-in-Class Non-Governmental Organization Business Intelligence in Just 48 Hours
20
Data Sources
45
Metrics / KPIs
40
Charts
1
AI decision making assistants
Launch Best-in-Class Non-Governmental Organization Business Intelligence in Just 48 Hours
20
Data Sources
45
Metrics / KPIs
40
Charts
1
AI decision making assistants
How quickly are donations increasing or decreasing over time?
What is the average donation size per campaign or fundraiser?
How much money has been collected in donations over time?


Virtual Show Room
If you want to see how leading NGOs use data to maximize impact, improve transparency, and guide strategic decisions, join our showroom session. We’ll walk you through the platforms they rely on — such as Salesforce Nonprofit Cloud, DevResults, DHIS2, and Power BI — and show how they integrate data across programs, funding, operations, and outreach. Together, we’ll explore key metrics like beneficiary reach, program effectiveness, cost-per-impact, donor retention, and grant utilization, and review real dashboards used for reporting to stakeholders, optimizing field operations, and measuring outcomes. By the end of the session, we’ll outline a tailored decision-making system built around your mission and impact goals.
Best Practice Data Stack
At Data Never Lies, we understand that NGOs depend on accurate, mission-driven data to demonstrate impact, secure funding, and improve program delivery. That’s why we build scalable analytics systems using tools like Salesforce Nonprofit Cloud, DevResults, DHIS2, and Power BI — customized to connect data across beneficiaries, field activities, donor reporting, and program outcomes. From tracking metrics like cost-per-beneficiary, program reach, impact indicators, and grant utilization rates, to automating reports for stakeholders and funders, we help turn complex data into clear, actionable insights. With our expertise, your data isn’t just organized — it becomes a powerful story that drives accountability, transparency, and change.
20 Data Sources
Launch Best-in-Class Non-Governmental Organization Company Business Intelligence in Just 48 Hours
Square
Square is a payment processing platform offering tools for point-of-sale transactions, online payments, invoicing, and business management.
Braintree
Braintree is a payment processing platform that enables businesses to accept online payments, mobile payments, and subscriptions securely.

Stripe
Stripe is a payment processing platform enabling businesses to accept online payments, manage subscriptions, and handle financial transactions securely.

PayPal
PayPal is an online payment platform that allows users to send, receive, and manage money securely and globally.
Amazon Pay
A payment gateway allowing donors to contribute using their Amazon account details, streamlining checkout experiences.

WePay
A payment processing service integrated with fundraising platforms, enabling nonprofits to accept online donations easily.
Venmo
A mobile payment app owned by PayPal, enabling peer-to-peer and nonprofit donations through a social-driven platform.
Authorize.net
secure payment gateway facilitating online transactions, including credit card processing and recurring donations.

DonorPerfect
comprehensive fundraising CRM helping nonprofits manage donor relationships, campaigns, and financial reporting.

Apple Pay
A digital wallet that enables quick, secure donations using Apple devices via fingerprint or facial recognition.

Google Pay
A digital wallet that allows seamless, secure donations via Android devices and online platforms.
Bloomerang
A donor management CRM designed for nonprofits to track contributions, donor engagement, and fundraising performance.
45 Metrics
Launch Best-in-Class Non-Governmental Organization Company Business Intelligence in Just 48 Hours
TDC
Total Donations Collected – The total amount of money received from all donors within a specific period, reflecting overall fundraising success.
ADA
Average Donation Amount – The total donations divided by the number of contributions, showing the typical amount given per donor.
DGR
Donation Growth Rate – The percentage change in total donations over time, indicating whether fundraising efforts are improving or declining.
RDP
Recurring Donation Percentage – The proportion of total donations coming from repeat donors, highlighting donor loyalty and predictable revenue streams.
DRR
Donor Retention Rate – The percentage of previous donors who contribute again, measuring long-term donor relationships and engagement.
NDA
New Donors Acquired – The number of first-time donors within a given period, reflecting the effectiveness of donor outreach and acquisition efforts.
FROI
Fundraising ROI – The total revenue generated for every dollar spent on fundraising, measuring the efficiency of fundraising strategies.
GSR
Grant Success Rate – The percentage of grant applications that receive funding, indicating the effectiveness of grant writing and submission efforts.
EPR
Event Participation Rate – The percentage of invited individuals who attend a fundraising event, reflecting outreach success and event appeal.
VHL
Volunteer Hours Logged – The total number of hours contributed by volunteers, measuring engagement and community support.
TTV
Time to Value (TTV) is the duration it takes for a customer to realize the benefits of a product or service.
UACSR
Upsell and Cross-sell Revenue is income generated by encouraging customers to purchase higher-value items or additional related products.
CRR
Customer Retention Rate is the percentage of customers a business retains over a specific period, reflecting loyalty and satisfaction.
CES
Customer Engagement Score measures a customer’s interaction level with a product or service, indicating their activity, loyalty, and satisfaction.
MAU
Monthly Active Users (MAU) is the number of unique users engaging with a product or service within a month.
40 Charts
Launch Best-in-Class Non-Governmental Organization Company Business Intelligence in Just 48 Hours
Retention Rate by Donor Segment
Tracks donor retention trends across different segments, identifying which groups are more likely to give again.
Recurring Donations by Month
Shows the proportion of monthly donations from recurring contributors, highlighting donor loyalty.
Donations Over Time
Tracks total donations received monthly, showing trends and seasonal fluctuations in fundraising.
Average Donation by Campaign
Average Donation by Campaign (Bar Chart) – Compares the average donation amount across different campaigns, highlighting which efforts attract larger contributions.
Donation Growth Over Time
Displays percentage changes in donations over time, illustrating fundraising trends and momentum.
ROI by Campaign
Measures marketing effectiveness by comparing return on investment across campaigns.
New Donors by Campaign
Compares the number of first-time donors acquired through various fundraising campaigns.
Grant Success Rate by Program
Compares grant approval rates across different programs, highlighting the most successful areas.
Participation by Event Type
Shows the percentage of attendees by event type, identifying the most engaging fundraising events.
Volunteer Hours by Month
Tracks the total number of volunteer hours contributed each month, revealing seasonal trends in participation.
Cost per Dollar by Campaign
Compares the amount spent to raise each dollar across different fundraising campaigns.
Engagement Score by Donor Segment
Measures donor involvement levels across different segments, considering donation frequency, event attendance, and interactions.
Revenue by Source
Breaks down total revenue by source, such as donations, grants, and sponsorships.
Engagement Rate by Platform
Compares interaction rates across social media and marketing platforms, highlighting the most effective channels.
Open Rate by Campaign
Displays the percentage of recipients who opened emails in different campaigns, evaluating email marketing effectiveness.
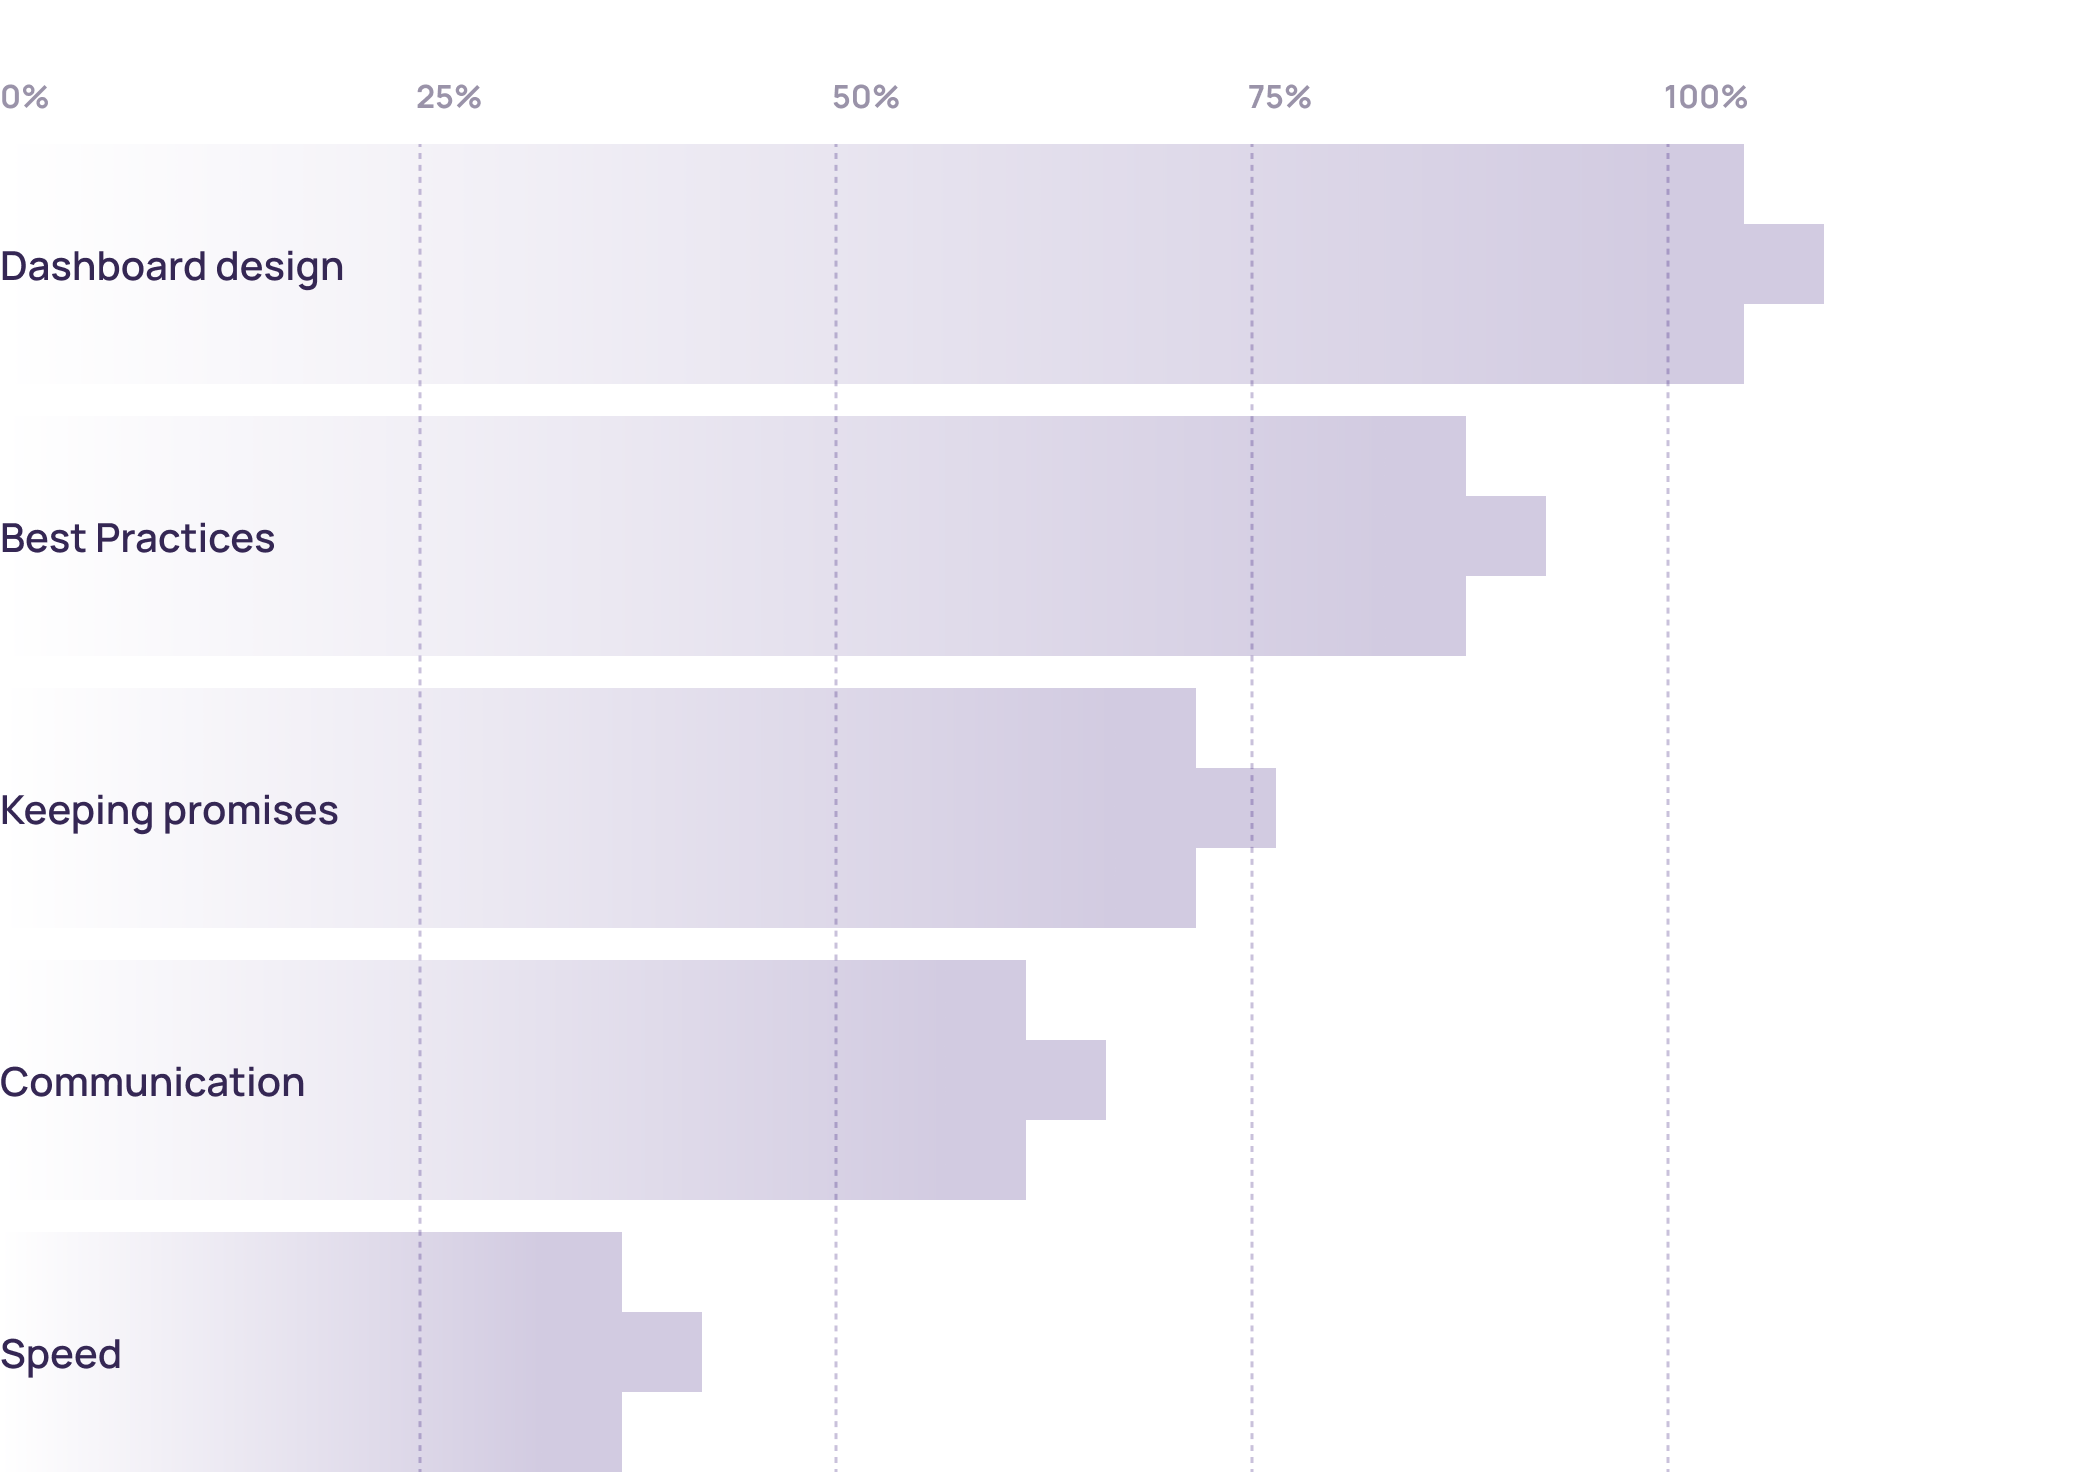
Why customers love us (>100 reviews)
We’ve identified the top five reasons why our clients choose to work with us and continue partnering with us for years.