Launch Best-in-Class Service Companies Business Intelligence in Just 48 Hours
36
Data Sources
45
Metrics / KPIs
61
Charts
2
AI decision making assistants
Launch Best-in-Class Service Companies Business Intelligence in Just 48 Hours
36
Data Sources
45
Metrics / KPIs
61
Charts
2
AI decision making assistants
Are we retaining customers over time, or are they leaving?
What are the average operational costs per job?
How often are technicians resolving issues on the first visit?


Virtual Show Room
If you want to see how leading service companies use data to improve client satisfaction and streamline operations, join our showroom session. We’ll walk you through the platforms they rely on — like ServiceTitan, Salesforce, Zoho, and Power BI — and show how they connect data from scheduling, customer feedback, and field operations. Together, we’ll explore key metrics such as response time, job completion rate, customer satisfaction scores (CSAT), and revenue per service call, and review real dashboards used to manage teams and optimize service delivery. By the end of the session, we’ll outline a prototype decision-making system tailored to your business needs.
Best Practice Data Stack
At Data Never Lies, we understand that service companies thrive on efficiency, responsiveness, and client satisfaction. That’s why we build scalable data systems using platforms like ServiceTitan, Jobber, Salesforce, and Power BI — tailored to track performance across scheduling, field service, and customer touchpoints. Whether you’re monitoring job completion rates, average response times, CSAT scores, or technician utilization, we design integrated analytics solutions that turn your operational data into clear, actionable insights. With our expertise, your data isn’t just structured — it becomes a strategic asset that helps you deliver better service, retain more clients, and grow with confidence.
36 Data Sources
Launch Best-in-Class Service Companies Company Business Intelligence in Just 48 Hours
ServiceTitan
A comprehensive field service management software for scheduling, dispatching, invoicing, and reporting, designed for service businesses.

Housecall Pro
A user-friendly platform for service professionals, offering tools for job scheduling, invoicing, and customer management.

Jobber
Field service software for small businesses, focusing on scheduling, invoicing, and customer relationship management.

FieldEdge
An all-in-one field service management solution with real-time dispatching, invoicing, and customer management features.

mHelpDesk
A field service software offering tools for job management, invoicing, and workflow automation for service businesses.

Workiz
A field service management software for small businesses, featuring scheduling, job tracking, and payment collection.

Verizon Connect
A fleet management platform combining GPS tracking, dispatching, and reporting to optimize service operations.
ServiceFusion
A field service management solution with tools for scheduling, invoicing, payments, and customer communication.

RazorSync
Field service software with scheduling, invoicing, and customer management tools, accessible via mobile and desktop.

Fieldwire
A field management app for jobsite coordination, task tracking, and real-time plan access to enhance productivity.

Oracle NetSuite
Oracle NetSuite is a cloud-based enterprise resource planning (ERP) software for managing finances, operations, customer relationships, and e-commerce.

QuickBooks
QuickBooks is accounting software designed to help businesses manage finances, track expenses, create invoices, and generate reports.
45 Metrics
Launch Best-in-Class Service Companies Company Business Intelligence in Just 48 Hours
JCR
Job Completion Rate: Percentage of scheduled jobs successfully completed as planned, reflecting operational efficiency and service reliability.
ART
Average Response Time: Average time taken to respond to customer inquiries or service requests, indicating service speed and responsivenessю
FTFR
First-Time Fix Rate: Percentage of issues resolved during the initial visit, highlighting technician preparedness and service effectiveness.
TUR
Technician Utilization Rate: Percentage of technician work hours spent on productive tasks, measuring workforce efficiency and resource optimization.
CSAT
Customer Satisfaction Score (CSAT): Metric based on customer feedback, measuring happiness with service quality and overall experience.
CRR
Customer Retention Rate: Percentage of customers retained over a period, indicating loyalty, satisfaction, and long-term business value.
RPJ
Revenue per Job: Average income generated from each job, indicating profitability and success in maximizing service value.
CPJ
Cost per Job: Average expense associated with completing a single job, reflecting cost management and operational efficiency.
RCR
Recurring Contract Revenue: Regular income from subscription or long-term agreements, ensuring predictable cash flow and financial stability.
LCR
Lead Conversion Rate: Percentage of leads turned into paying customers, showcasing sales process effectiveness and marketing success.
TTR
Technician Turnover Rate: Percentage of technicians leaving the company within a given timeframe, reflecting workforce stability and satisfaction.
JSE
Job Scheduling Efficiency: Ability to assign and manage jobs effectively, minimizing downtime and maximizing resource utilization.
CAC
Customer Acquisition Cost (CAC): Average cost of gaining a new customer, including marketing, sales, and operational expenses.
CR
Upsell/ Cross-sell Revenue: Additional income from selling upgrades or complementary services/products to existing customers, increasing overall revenue
JCR
Job Cancellation Rate: Percentage of scheduled jobs canceled, indicating potential issues in scheduling, customer commitment, or communication.
61 Charts
Launch Best-in-Class Service Companies Company Business Intelligence in Just 48 Hours
Completion Rate Over Time
Line chart tracking the percentage of jobs completed weekly, showing trends in operational efficiency.
Response Time by Region
Bar chart comparing average customer response times across regions, highlighting service performance variations.
First-Time Fix by Technician
Bar chart showing the percentage of first-visit issue resolutions by each technician, reflecting individual effectiveness.
URBTUtilization Rate by Technician
Bar chart displaying the productive work percentage for each technician, measuring workforce efficiency.
CSAT by Technician
Bar chart showing customer satisfaction scores per technician, indicating service quality and client feedback.
Revenue per Job Over Time
Line chart tracking average income per job weekly, revealing profitability trends.
Cost per Job Over Time
Line chart showing average expenses per job over time, highlighting cost management performance.
Retention Rate by Month
Line chart tracking the percentage of retained customers monthly, illustrating loyalty trends.
Recurring Revenue Over Time
Line chart showing subscription or contract revenue trends monthly, reflecting financial stability.
Upsell Revenue by Technician
Bar chart comparing additional revenue generated by each technician through upselling, reflecting sales skills.
Time to Schedule Over Time
Line chart tracking the average time taken to schedule jobs, highlighting scheduling efficiency trends.
CAC by Channel
Bar chart analyzing customer acquisition costs by lead source, identifying the most cost-efficient channels.
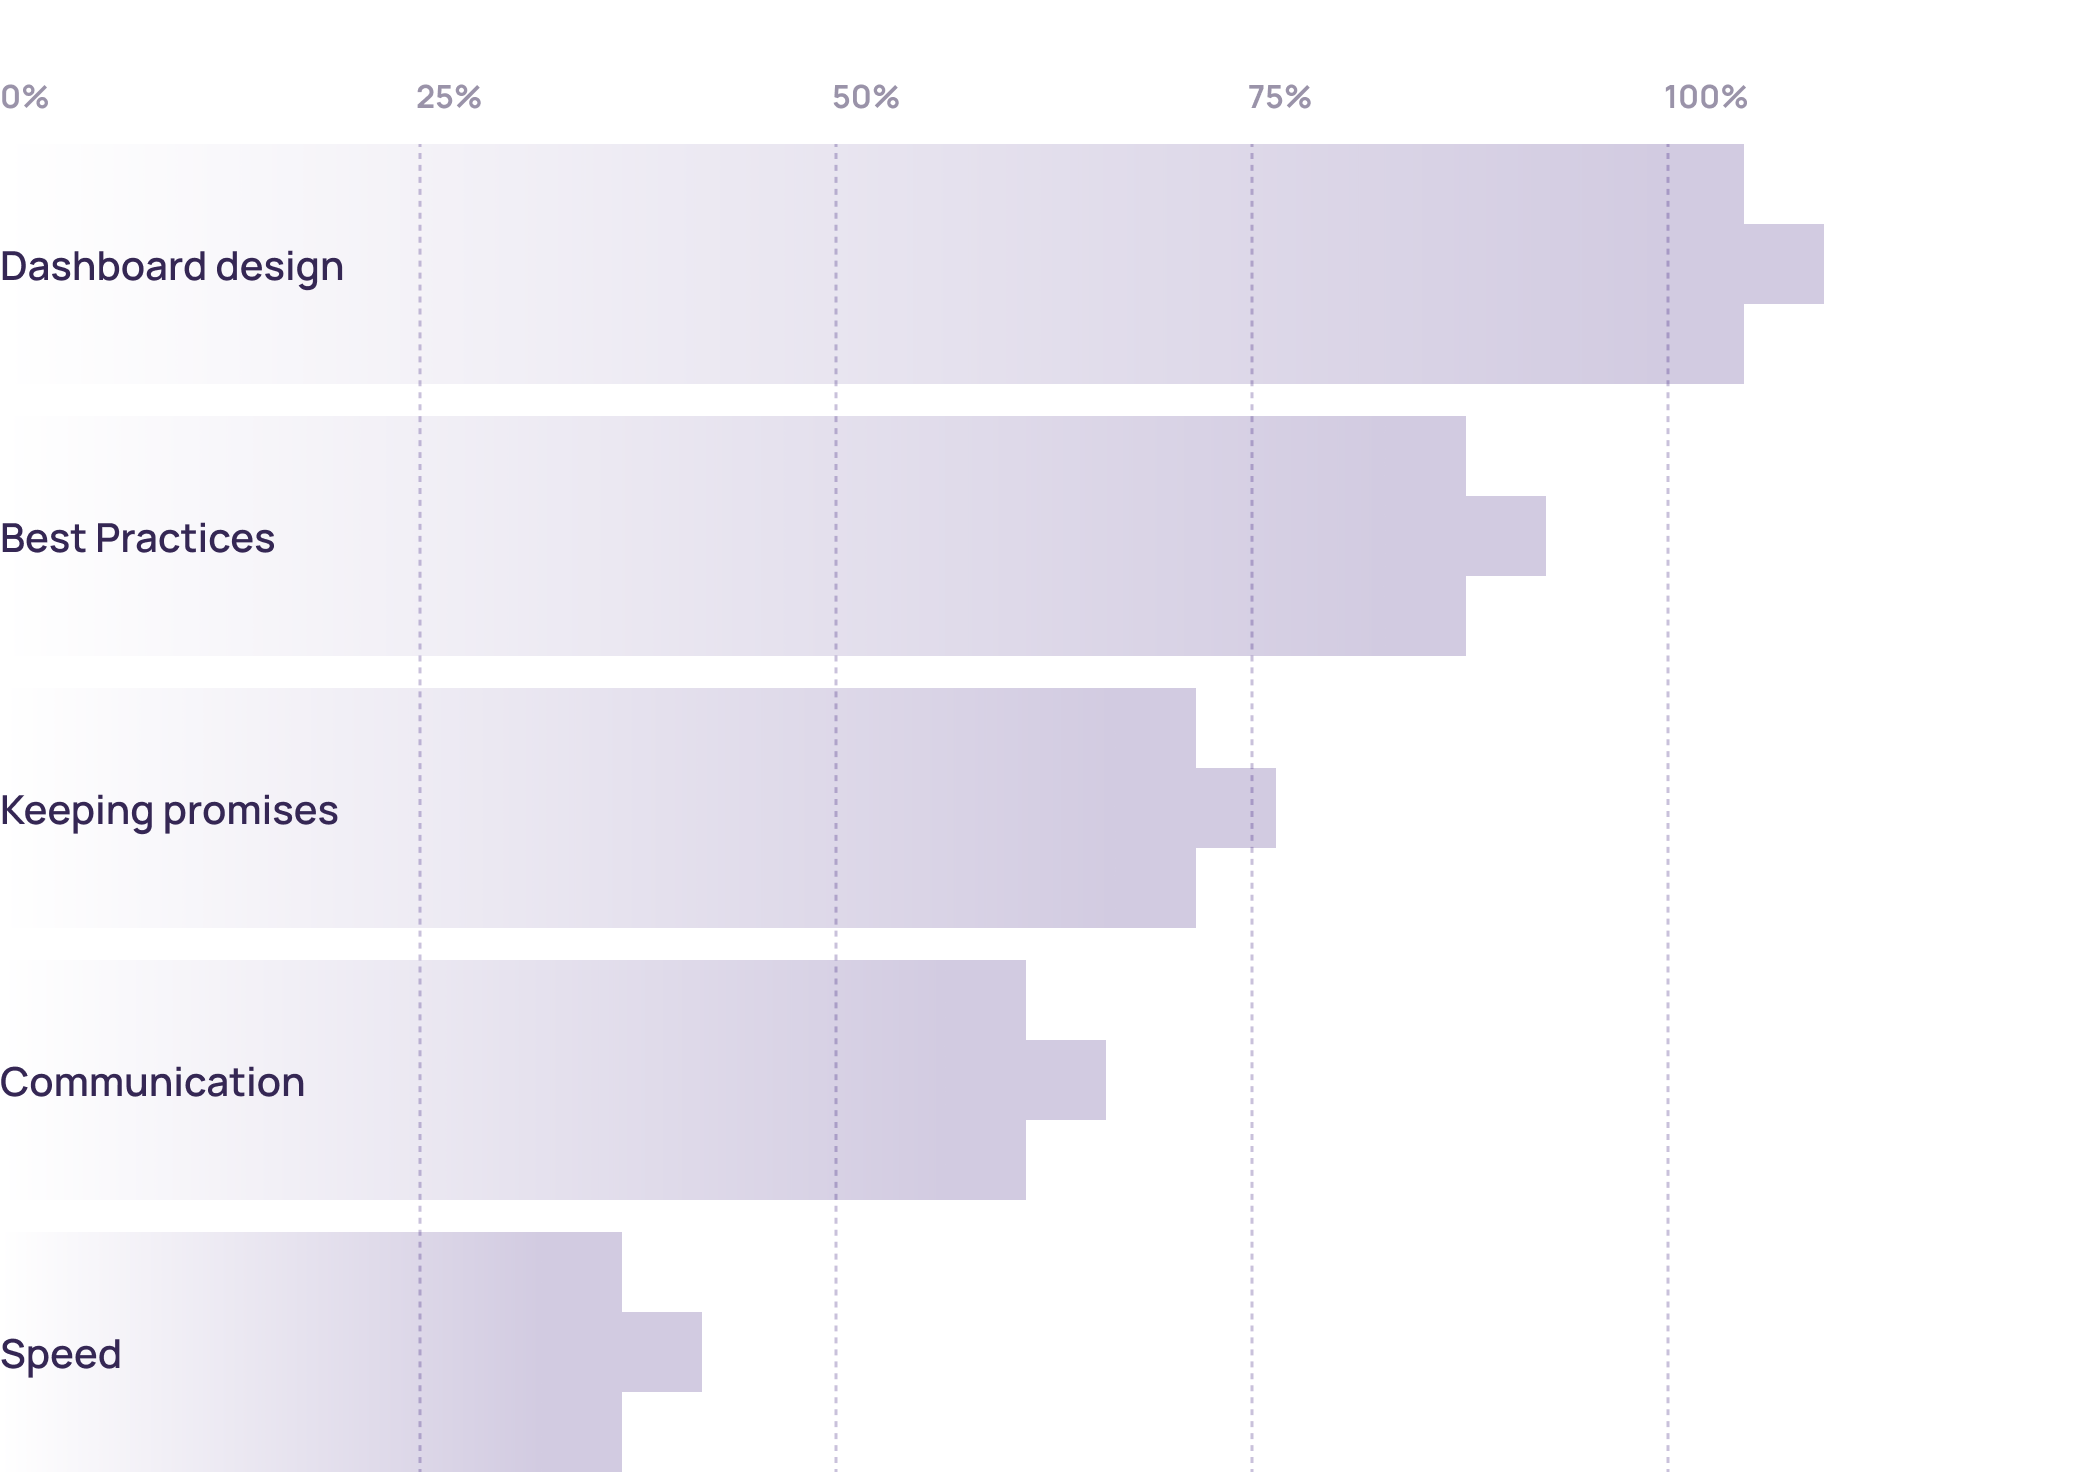
Why customers love us (>100 reviews)
We’ve identified the top five reasons why our clients choose to work with us and continue partnering with us for years.